 Portuguese
  English
  Spanish
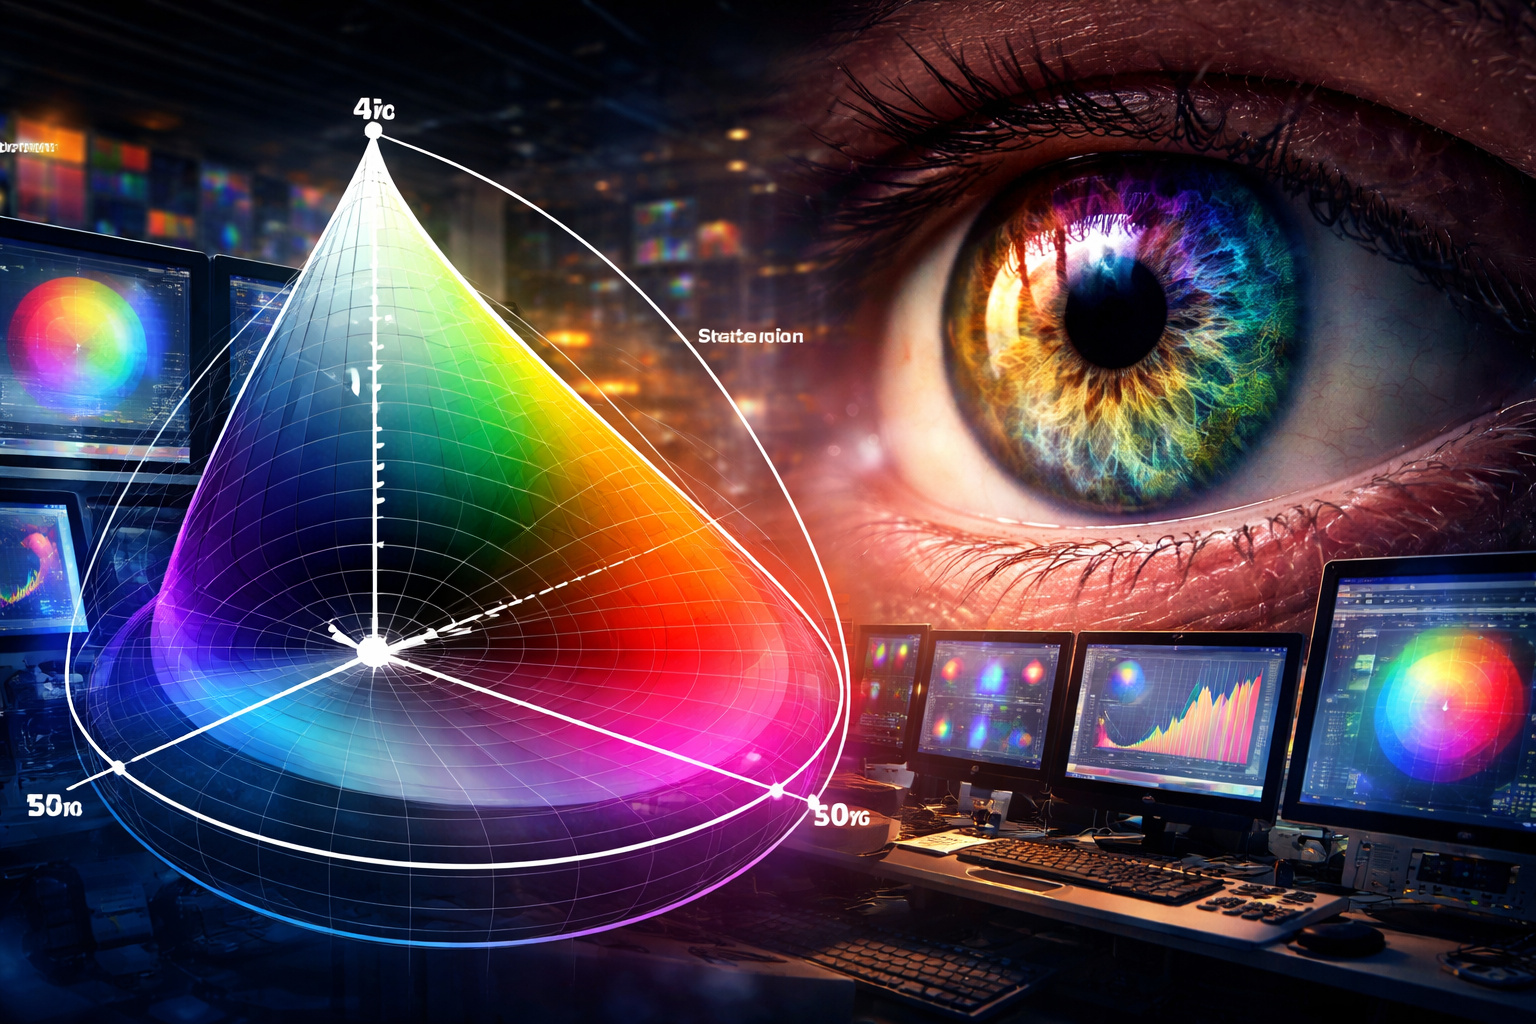
A Team From The Los Alamos National Laboratory Completed The Missing Mathematics In The Color Theory Model Of Schrödinger By Defining The Neutral Axis Of Gray Tones And Showed Why Hue, Saturation, And Brightness Are Born From The Geometry Of Human Vision
Have you ever wondered what your eyes do with a color before it reaches your brain? Now imagine that, for almost 100 years, a mathematical detail remained unanswered within a famous color theory, created by Erwin Schrödinger, the same name behind the most cited cat in physics.
It was this detail that a group of scientists in the United States claims to have solved.
And the impact goes far beyond academic curiosity. When color needs to be measured rigorously in control room displays, sensors, technical images, and scientific visualization, any missing piece turns into noise, error, and rework.
-
U.S. Department of War project promises to recharge drones in the air using radio waves so a swarm can fly without ever landing.

-
The size of a thermos, Xiaomi announces a portable coffee maker with a 7,500 mAh battery, capable of preparing up to 400 coffees, professional pressure of 20 bar, and fast charging via USB-C.

-
Startup creates “robot cowboys” with drones that move cattle via cell phone, reduce the use of motorcycles, horses, and helicopters, and also monitor weight, pasture, water, and sick animals on farms.
-
Saudi Arabia launched the first hydrogen truck that drives itself and travels 1,500 kilometers without stopping.


An Old Problem Seemed Small, But Blocked The Invisible Rule That Measures Colors And Disrupted From Monitor To Sensor
Schrödinger proposed, in the 1920s, that human vision could be described as a 3-dimensional map, drawn from the response of the cones in the eye, those receptors connected to red, green, and blue.
In this map, the qualities we use to talk about color, hue, saturation, and brightness, would be a consequence of the very shape of this space.
But there was a sensitive point. For this rule to work, it was necessary to mathematically define a reference that everyone uses without thinking.
The reference is simple to imagine. It is the line of grays, which goes from black to white, passing through all intermediate tones.
The text calls this the neutral axis.
The problem is that Schrödinger never expressed this axis in the form of an equation, even though its definitions depend on that.
Without this “zero” properly tied, comparing colors with precision becomes a pretty promise but with gaps.
The Background That Led To The Find, A Team Trying To Improve Algorithms Encountered A Hidden Error In Color Theory
The spark came from a very down-to-earth place.
The team led by Roxana Bujack, a computer scientist at the Los Alamos National Laboratory, was working with scientific visualization algorithms when they noticed something was off.
It wasn’t a matter of taste, like “this color looks brighter.” It was mathematics.
The old theory had gaps that appeared in practice when you try to model color as measurable distance, as if each difference in tone was a step on a map.
That’s when they pointed out the main bottleneck, the neutral axis.
And they decided to resolve what was missing, even if it required stepping outside the path that the original theory followed.
The Turn In The Engineering Of The Model, They Defined The Neutral Axis Outside The Old Scheme And Gave A New Outline To The Color Space
To close the gap, the group worked outside the Riemannian model used as a historical basis, a way to describe curved spaces, instead of perfect straight lines.
You can think of it this way: if you try to measure distance on a globe, the shortest route isn’t a straight line on paper; it’s a path that follows the curvature.
The team used advanced geometry to define the neutral axis and, with that, complete the map.
With the axis tied down, the idea of “distance between colors” gains a more solid ground. And this affects something that the lay reader feels in their daily life but rarely can explain.
Why do two people argue about whether one blue is more purple, or if one red has become more “washed out”.
The study claims that these qualities do not depend on culture or learned experience. They would already be embedded in the very mathematical structure of vision.
In other words, the “shape” of our visual system pushes perception toward these three classic boxes: hue, saturation, and brightness.
The Silent Dispute Between The Eye And The Machine, What This Mathematics Promises For Screens, Technical Images, And Industrial Control
When color becomes data, the conversation shifts to another level.
A control room display, an instrumentation panel, an inspection image, a simulation visualization, all these use color to guide quick decisions. And quick decisions hate ambiguity.
This is where the news takes on an industrial face.
The study starts from a central point: there is a metric, a way to measure color difference as geometric distance.
This is the type of concept that interests those who work with systems that depend on visual reading because the goal is to reduce the chances of the eye misinterpreting what the machine tried to show.
There isn’t an official number released regarding economic impact, market adoption, or productivity gains.
Still, experts often remind us that, the better the color standardization in technical visualization, the lower the chance of human error in interpreting graphs, heat maps, and dashboards.
And this appears in a chain, from software development to operation.
The Detail That Ruined Everything, The Bezold Brücke Effect And The Swap Of The Straight Line For The Shortest Path In The Color Map
There’s one more point that catches attention because it seems tricky.
The text mentions the Bezold Brücke effect, when you increase brightness and the color seems to change hue.
You adjust the brightness, but your brain swears that the “color” changed too.
To deal with this, the team didn’t treat the path between two colors as a straight line on the map. They used the shortest path within the geometry of the model, as a natural route in this curved space.
For the lay reader, the message is simple.
The mathematics that tries to mimic human vision must accept that the space of perception does not behave like a piece of paper.
It bends, and the shortcuts are different.
The Domino Effect That Puts This Discovery On The Table Now, What Changes When Color Ceases To Be Sensation And Enters The Field Of Measurement
The curiosity here is not just “they solved an old problem”.
It’s what this kind of adjustment means when color needs to be treated as part of a system, not as an opinion.
The study claims that hue, saturation, and brightness do not appear simply because someone learned to name color this way or that way. They would be embedded in the mathematics of vision.
This changes the conversation among areas that always bump into this issue. That is, among those who build models and visualization algorithms, who calibrate displays and display patterns, and those who work with technical images and rapid interpretation.
There isn’t an official number released regarding when this approach will translate into products, software, or standards.
But the message that remains is direct. When theory gains the missing piece, engineering can discuss application with less “guesswork” and more precision.
In the end, what caught attention was this: a detail that seemed small in the color theory, the gray axis, was what separated an elegant foundation from a truly usable map to measure color consistently.
What do you think, does it make sense to say that most arguments about color arise more from our eyes than from the screen, or have you seen cases where the problem was indeed calibration?


-

-

-

-

29 people reacted to this.