 Português
  Inglês
  Espanhol
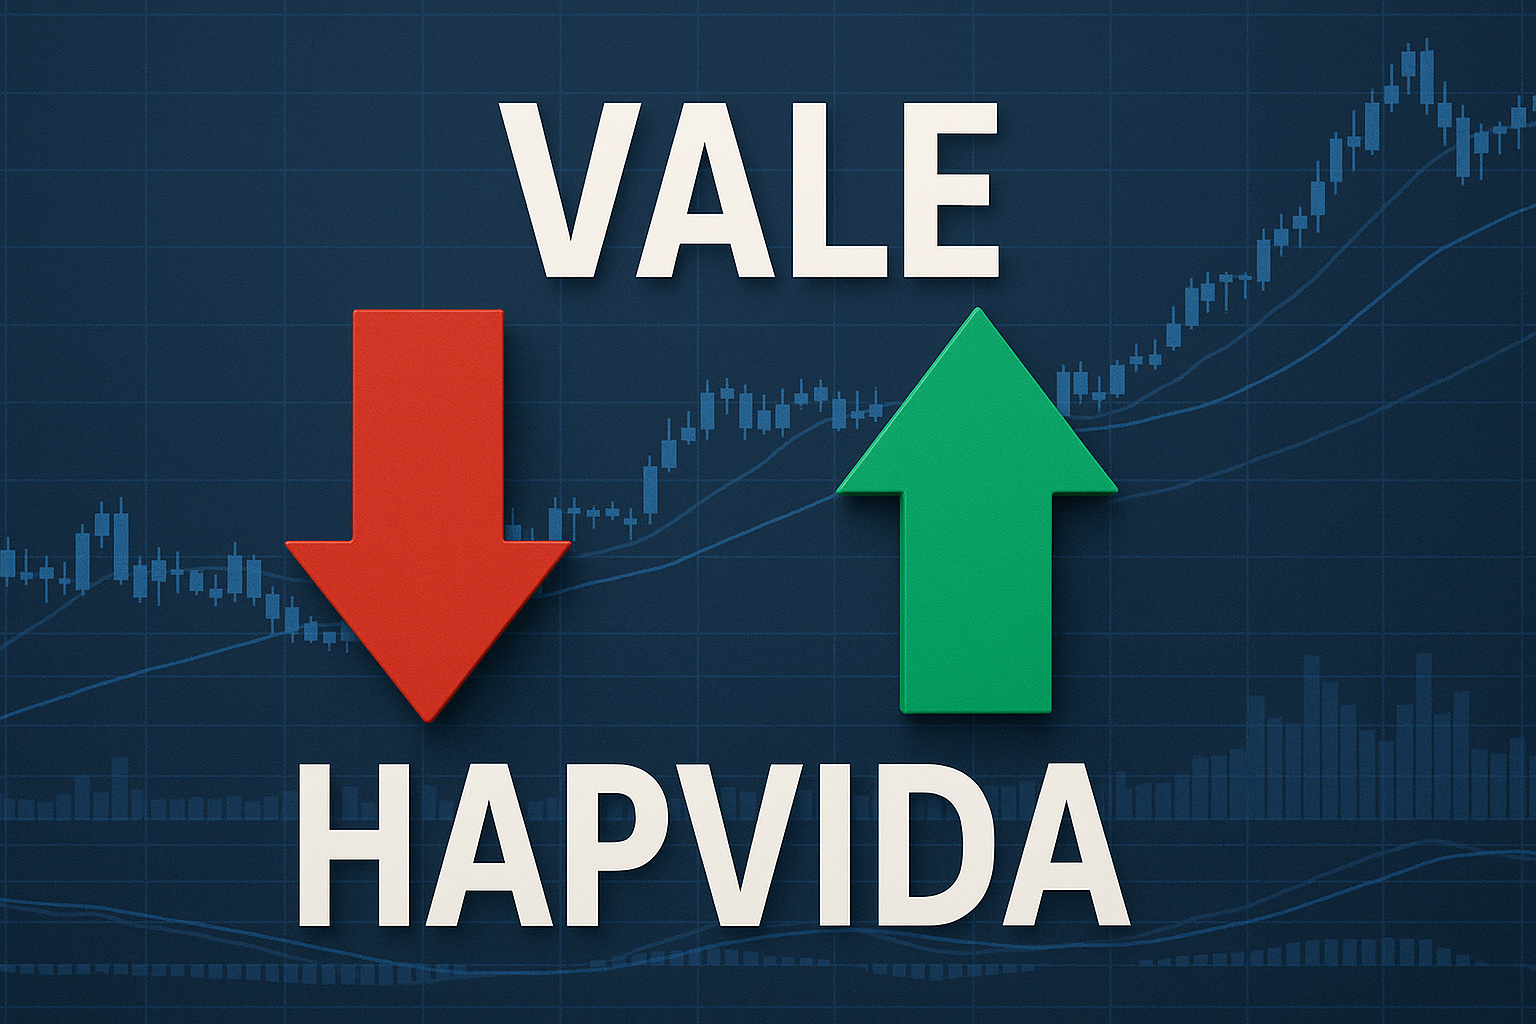
Vale Soars While Hapvida Hits Historical Lows; the IFR Exposes Extremes That Raise Alerts and Move the Market.
Vale Soars and Hapvida Plummets: IFR Exposes Extremes and Moves the Economy
The Brazilian Economy is experiencing one of the most striking contrasts of the year, and corporate news this week reinforces the disparity between market giants.
Vale and Hapvida are at the center of opposite movements, revealed by the Relative Strength Index (IFR), an essential indicator of technical analysis. While Vale soars with buying strength and approaches a potential correction, Hapvida collapses to historical lows, raising alerts about intense selling pressure.
The data became clear in this latest market reading, which shows how each company faces completely different challenges and opportunities in the short term.
-
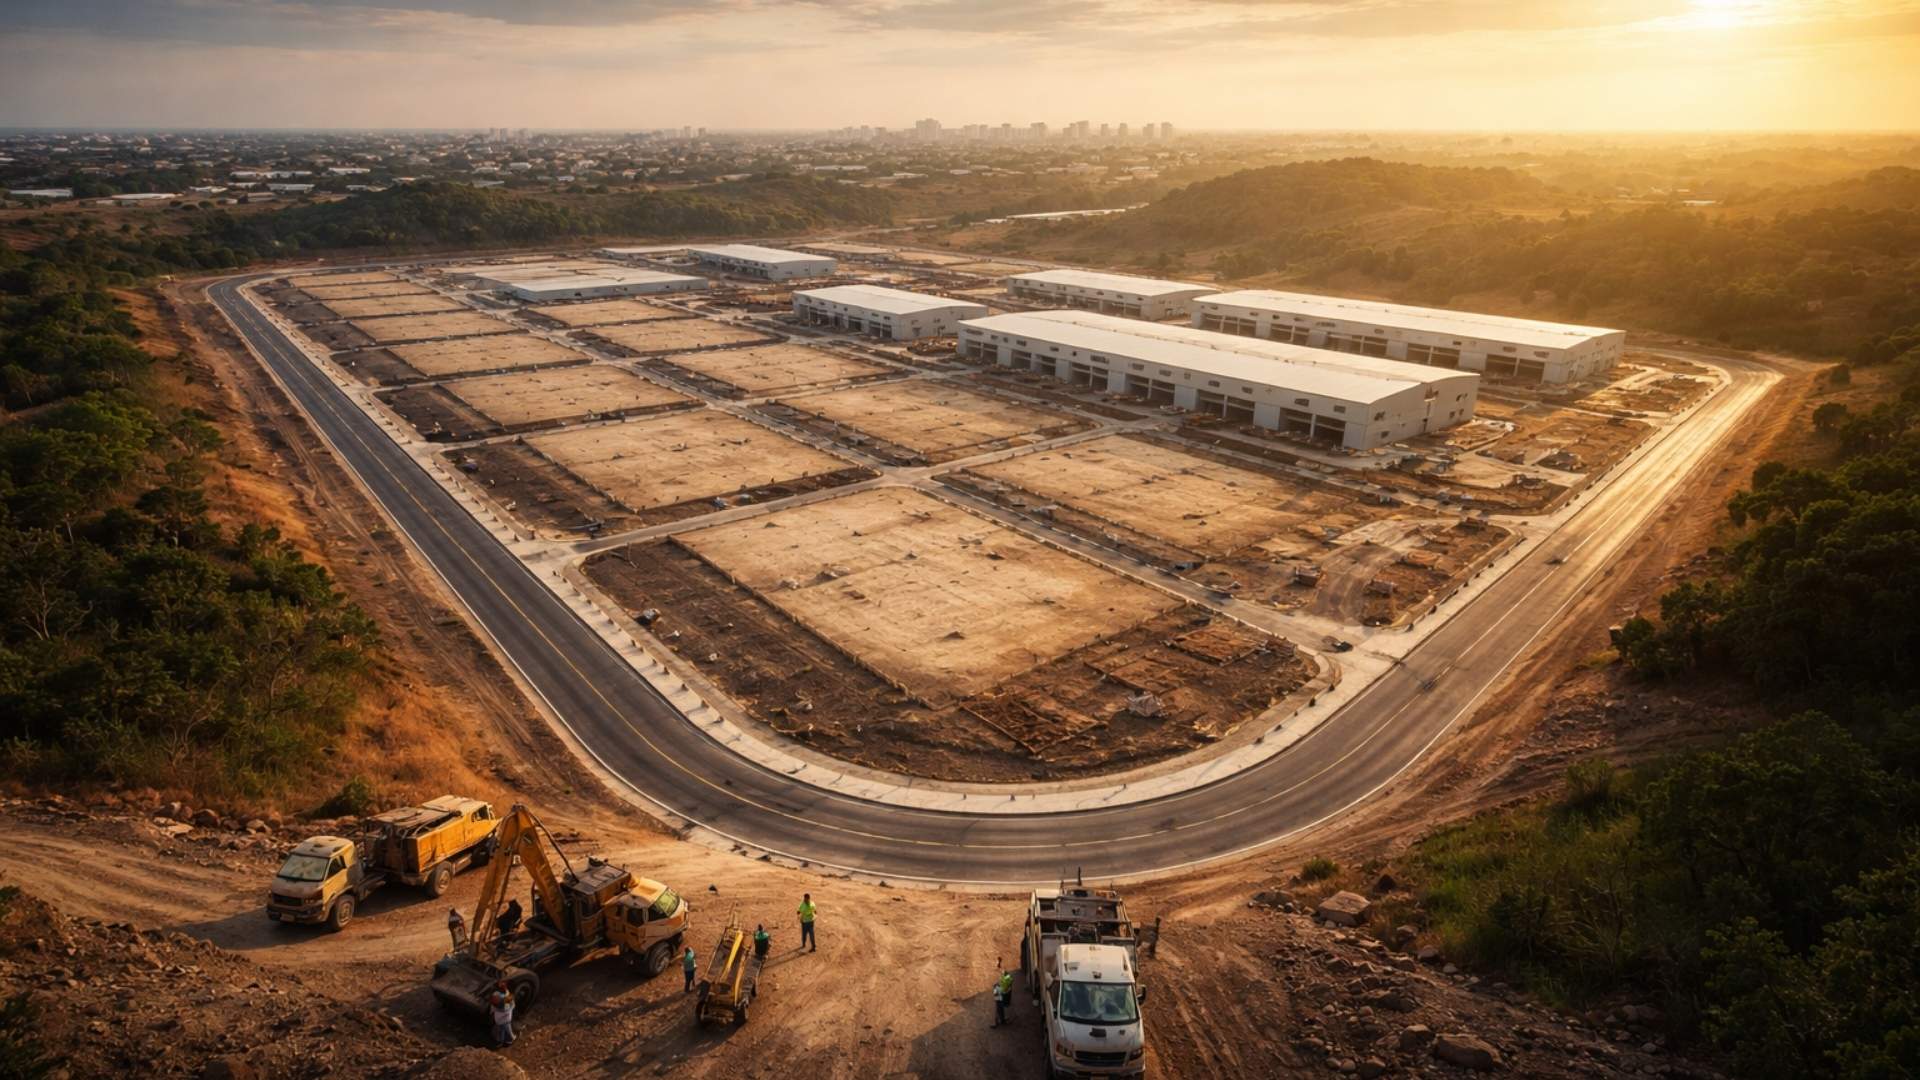
Brazilian city gains industrial hub for 85 companies that is equivalent to 55 football fields.

-
Peugeot and Citroën factory in Argentina cuts production by half and opens a layoff program for more than 2,000 employees after Brazil drastically reduced purchases of Argentine vehicles.

-
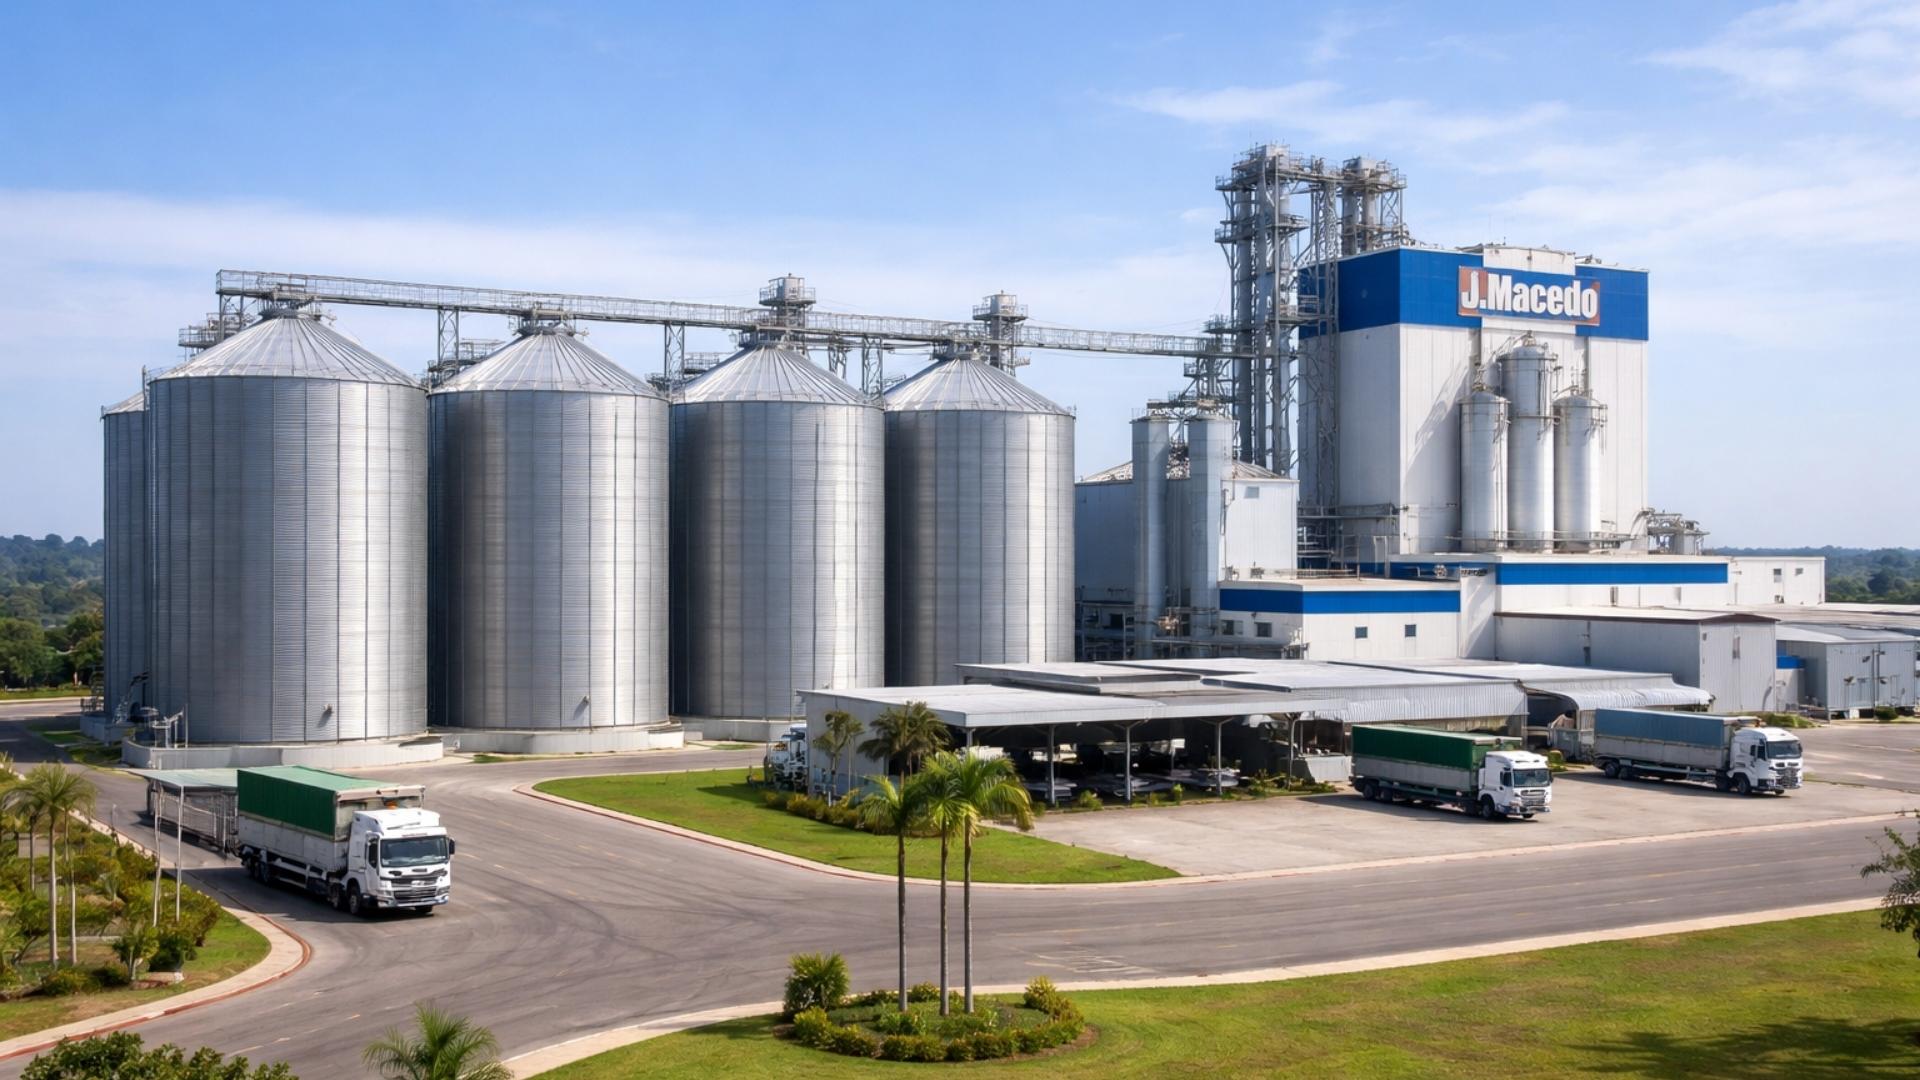
A Brazilian city gains a factory worth R$ 300 million with the capacity to process 200 thousand tons of wheat per year, a mill of 660 tons/day, silos for 42 thousand tons, and an industrial area of 276 thousand m².
-
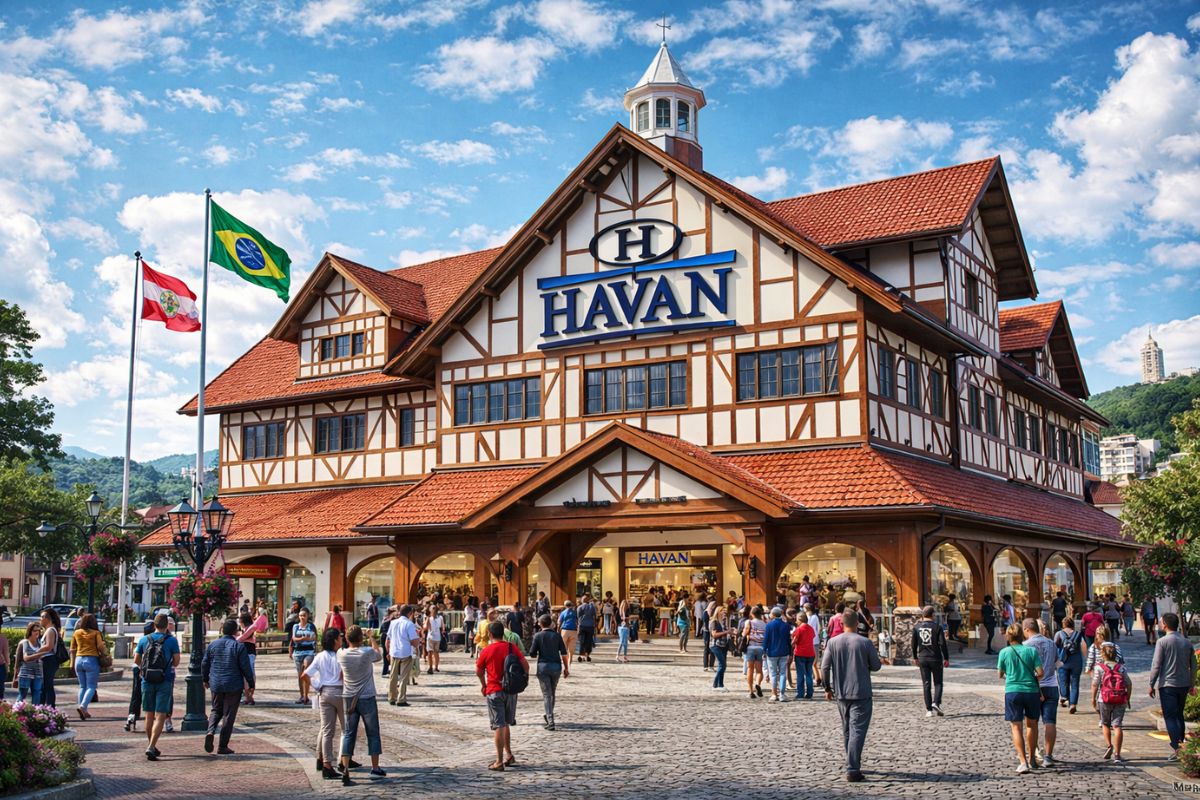
Havan will leave the shopping mall in Blumenau to inaugurate something that the chain has never done before: a megastore in half-timbered style in the Historic Center of the city, which is expected to be completed in May and change the landscape of local retail.

The survey indicates that Vale is operating in a full overbought region, with an IFR of 71.89 points, following an impressive streak of gains.
On the other hand, Hapvida suffers one of the worst performances in the Ibovespa in 2025, marking an IFR of 21.09 points, typical of overselling. These numbers help explain why investors are turning their attention to the two stocks.
IFR Reveals Extremes and Moves the Market
The Relative Strength Index, used to measure the strength of price movements between 0 and 100, provides a quick snapshot of asset behavior. Thus, readings above 70 suggest overbought conditions, while values below 30 indicate oversold conditions.
In this way, Vale appears to be in a full moment of euphoria, while Hapvida faces ongoing selling pressure. On the other hand, the IFR indicates that intense movements do not always mean immediate reversals, but can signal points of attention for the investor tracking the Economy and corporate news.
Additionally, other names also emerge in overbought territory, such as Weg, Bradespar, Klabin, and Suzano. On the opposite side, stocks like Brava, C&A, Lojas Renner, and TIM face weaker technical conditions.
Vale Renews Highs and Remains Strong, but IFR Suggests Caution
The strong appreciation of Vale in 2025 — accumulating a gain of 37.72% — has reignited optimism in the mining sector. The company recently renewed its annual high at R$ 72.39, confirming buying dominance. Thus, the asset remains above the main moving averages, reinforcing the upward trend.
However, the IFR at 71.89 points indicates that the stock may be stretched, opening up room for technical adjustments in the short term. Nonetheless, analysts emphasize that corrections do not alter the main trend.
Resistance Levels: R$ 72.39; R$ 74.42; R$ 78.48 (historical high).
Support Levels: R$ 69.92; R$ 66.89; R$ 63.87; R$ 62.71; R$ 61.18; R$ 58.75.
Thus, Vale’s movements remain relevant for investors attentive to the Economic fluctuations in the commodities market.
Hapvida Renews Lows and Intensifies Historical Drop
Meanwhile, Hapvida faces an opposite scenario. The stock has accumulated a drop of 56.74% in 2025 and renewed its historical low in the region of R$ 13.86. The company continues trading below the averages, reinforcing the predominance of selling strength.
The IFR at 21.09 points confirms the oversold zone, potentially opening space for a technical rebound. However, this would require the entry of consistent buying flow — something that has yet to appear on the chart.
Resistance Levels: R$ 15.61; R$ 16.75; R$ 17.90; R$ 20.00; R$ 22.50.
Support Levels: R$ 13.86; R$ 12.45; R$ 11.60; R$ 10.00; R$ 9.75.
Thus, Hapvida becomes a striking case of how selling pressure can undermine an asset even after long periods of optimism in the health sector.
Vale and Hapvida Movements Dominate Corporate News
In this way, the extremes experienced by the two stocks reignite debates about risk, trend, and timing in the market. IFR readings help understand why the market reacts with such asymmetry. While Vale attracts buyers and rises vigorously, Hapvida struggles to find stability amid pessimism.
For investors tracking the Economy, the scenario reinforces the need to monitor technical indicators and price behavior, especially in stocks with high volatility.


-

-

3 pessoas reagiram a isso.