 Portuguese
  English
  Spanish
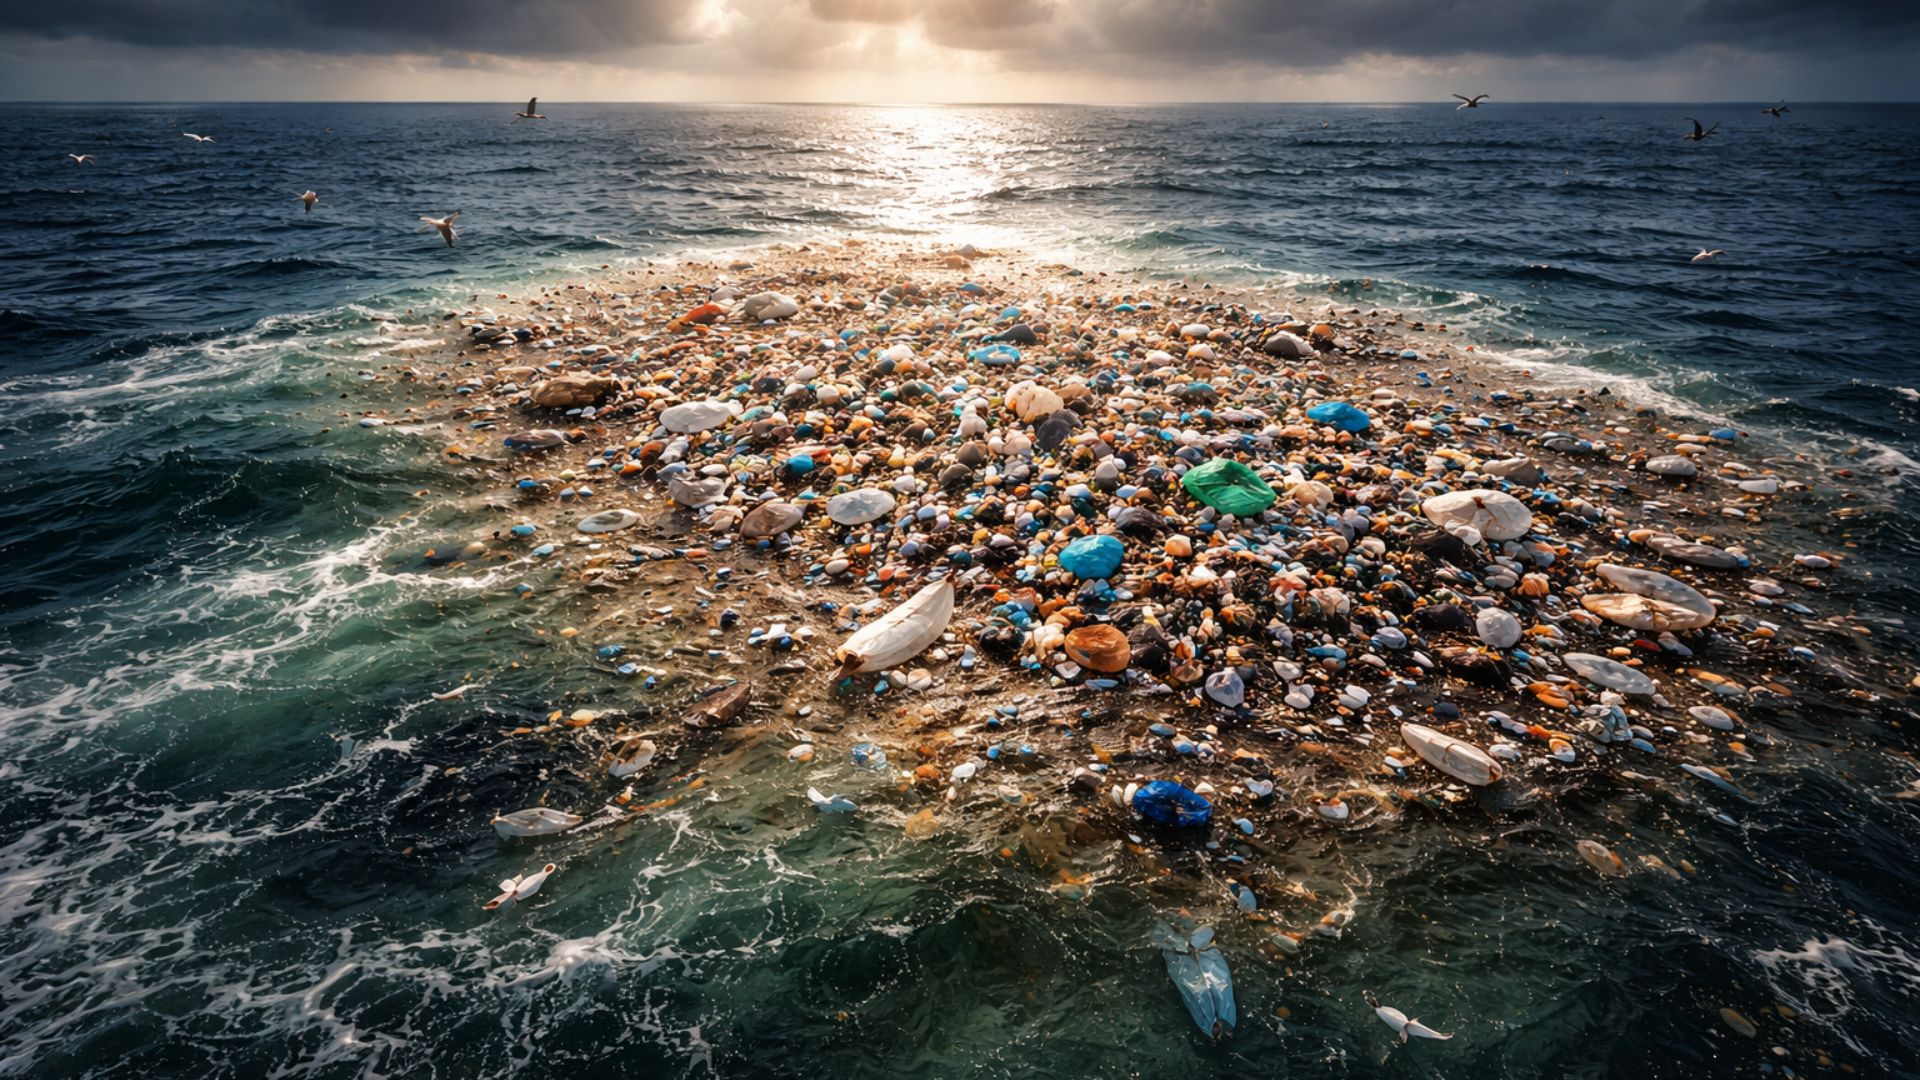
Maps of the Air Reveal Invisible Gases with Daily Global Measurements and Identify Installation-Level Emissions, Transforming Pollution into Observable Data. Study Published in Science Estimates Millions of Tons of Methane Linked to Thousands of Points, While Sentinel-5P Monitors NO₂, SO₂, and CO on a Planetary Scale.
Pollution that is not visible to the naked eye is gaining a new type of global “radar”: satellites capable of measuring trace gases in the atmosphere and, in some cases, pinpointing installation-level emissions.
In one of the most direct pieces of evidence for this change, a study published in the journal Science estimated emissions from the energy sector based on high-resolution observations and reported the detection of 8.30 ± 0.24 million tons of methane per year associated with 3,114 emitting points.
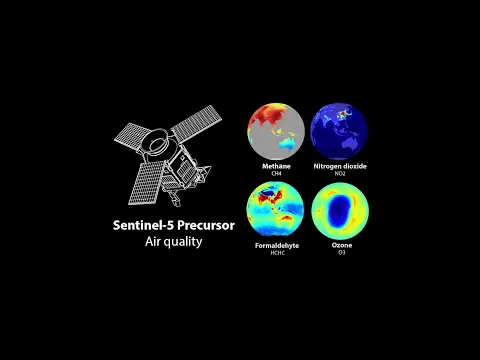
In daily and planetary monitoring, the Copernicus Sentinel-5P mission, equipped with the TROPOMI instrument, produces daily global observations of gases such as NO₂, SO₂, and CO, which are used in air quality and atmospheric composition analyses.
-
Friends have been building a small “town” for 30 years to grow old together, with compact houses, a common area, nature surrounding it, and a collective life project designed for friendship, coexistence, and simplicity.

-
This small town in Germany created its own currency 24 years ago, today it circulates millions per year, is accepted in over 300 stores, and the German government allowed all of this to happen under one condition.

-
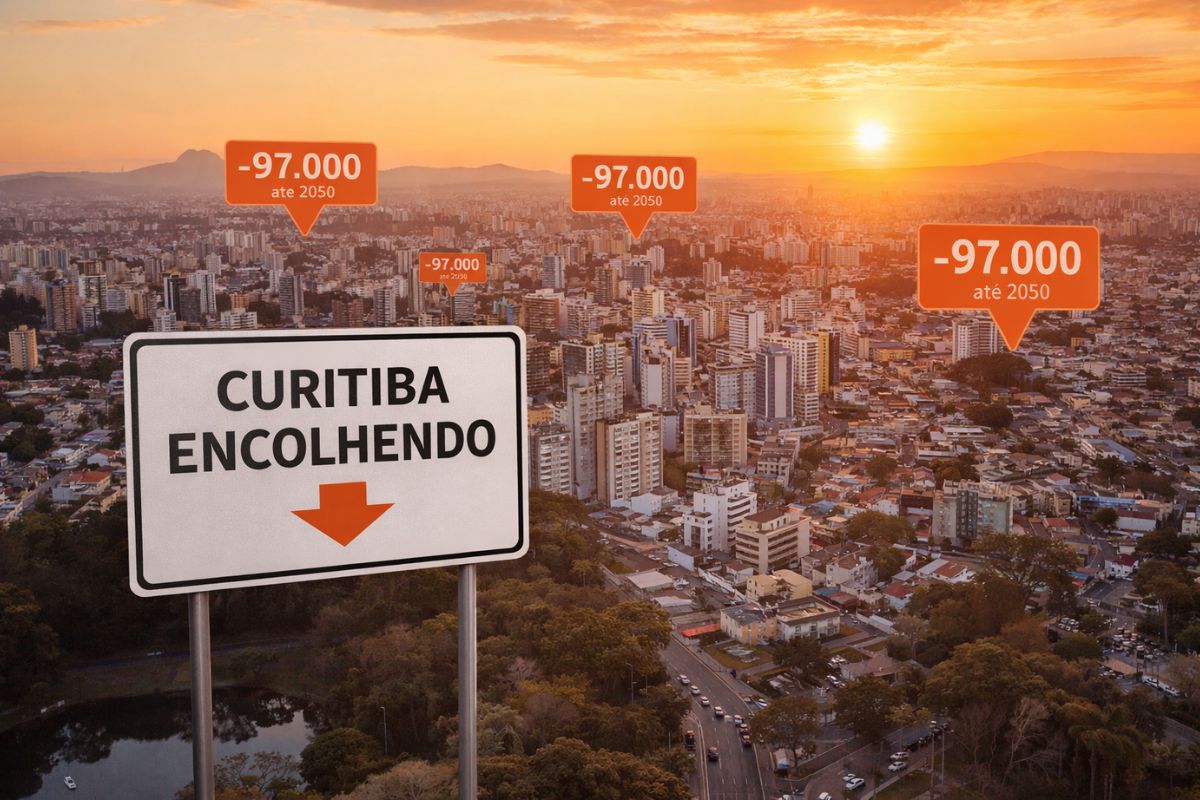
Curitiba is shrinking and is expected to lose 97,000 residents by 2050, while inland cities in Paraná such as Sarandi, Araucária, and Toledo are experiencing accelerated growth that is changing the entire state’s map.
-
Tourists were poisoned on Everest in a million-dollar fraud scheme involving helicopters that diverted over $19 million and shocked international authorities.

The leap lies not only in the volume of data but in what it enables: comparing regions, tracking variations over short intervals, and relating concentration patterns to human sources and activities.
At the same time, the combination of sensors with different scales—some focused on daily global maps, others aimed at more detailed measurements—opens the door for pollution diagnosis to no longer rely solely on indirect estimates and to be supported by systematic observations of the planet.
Methane Measured from Space and Emissions at Thousands of Points
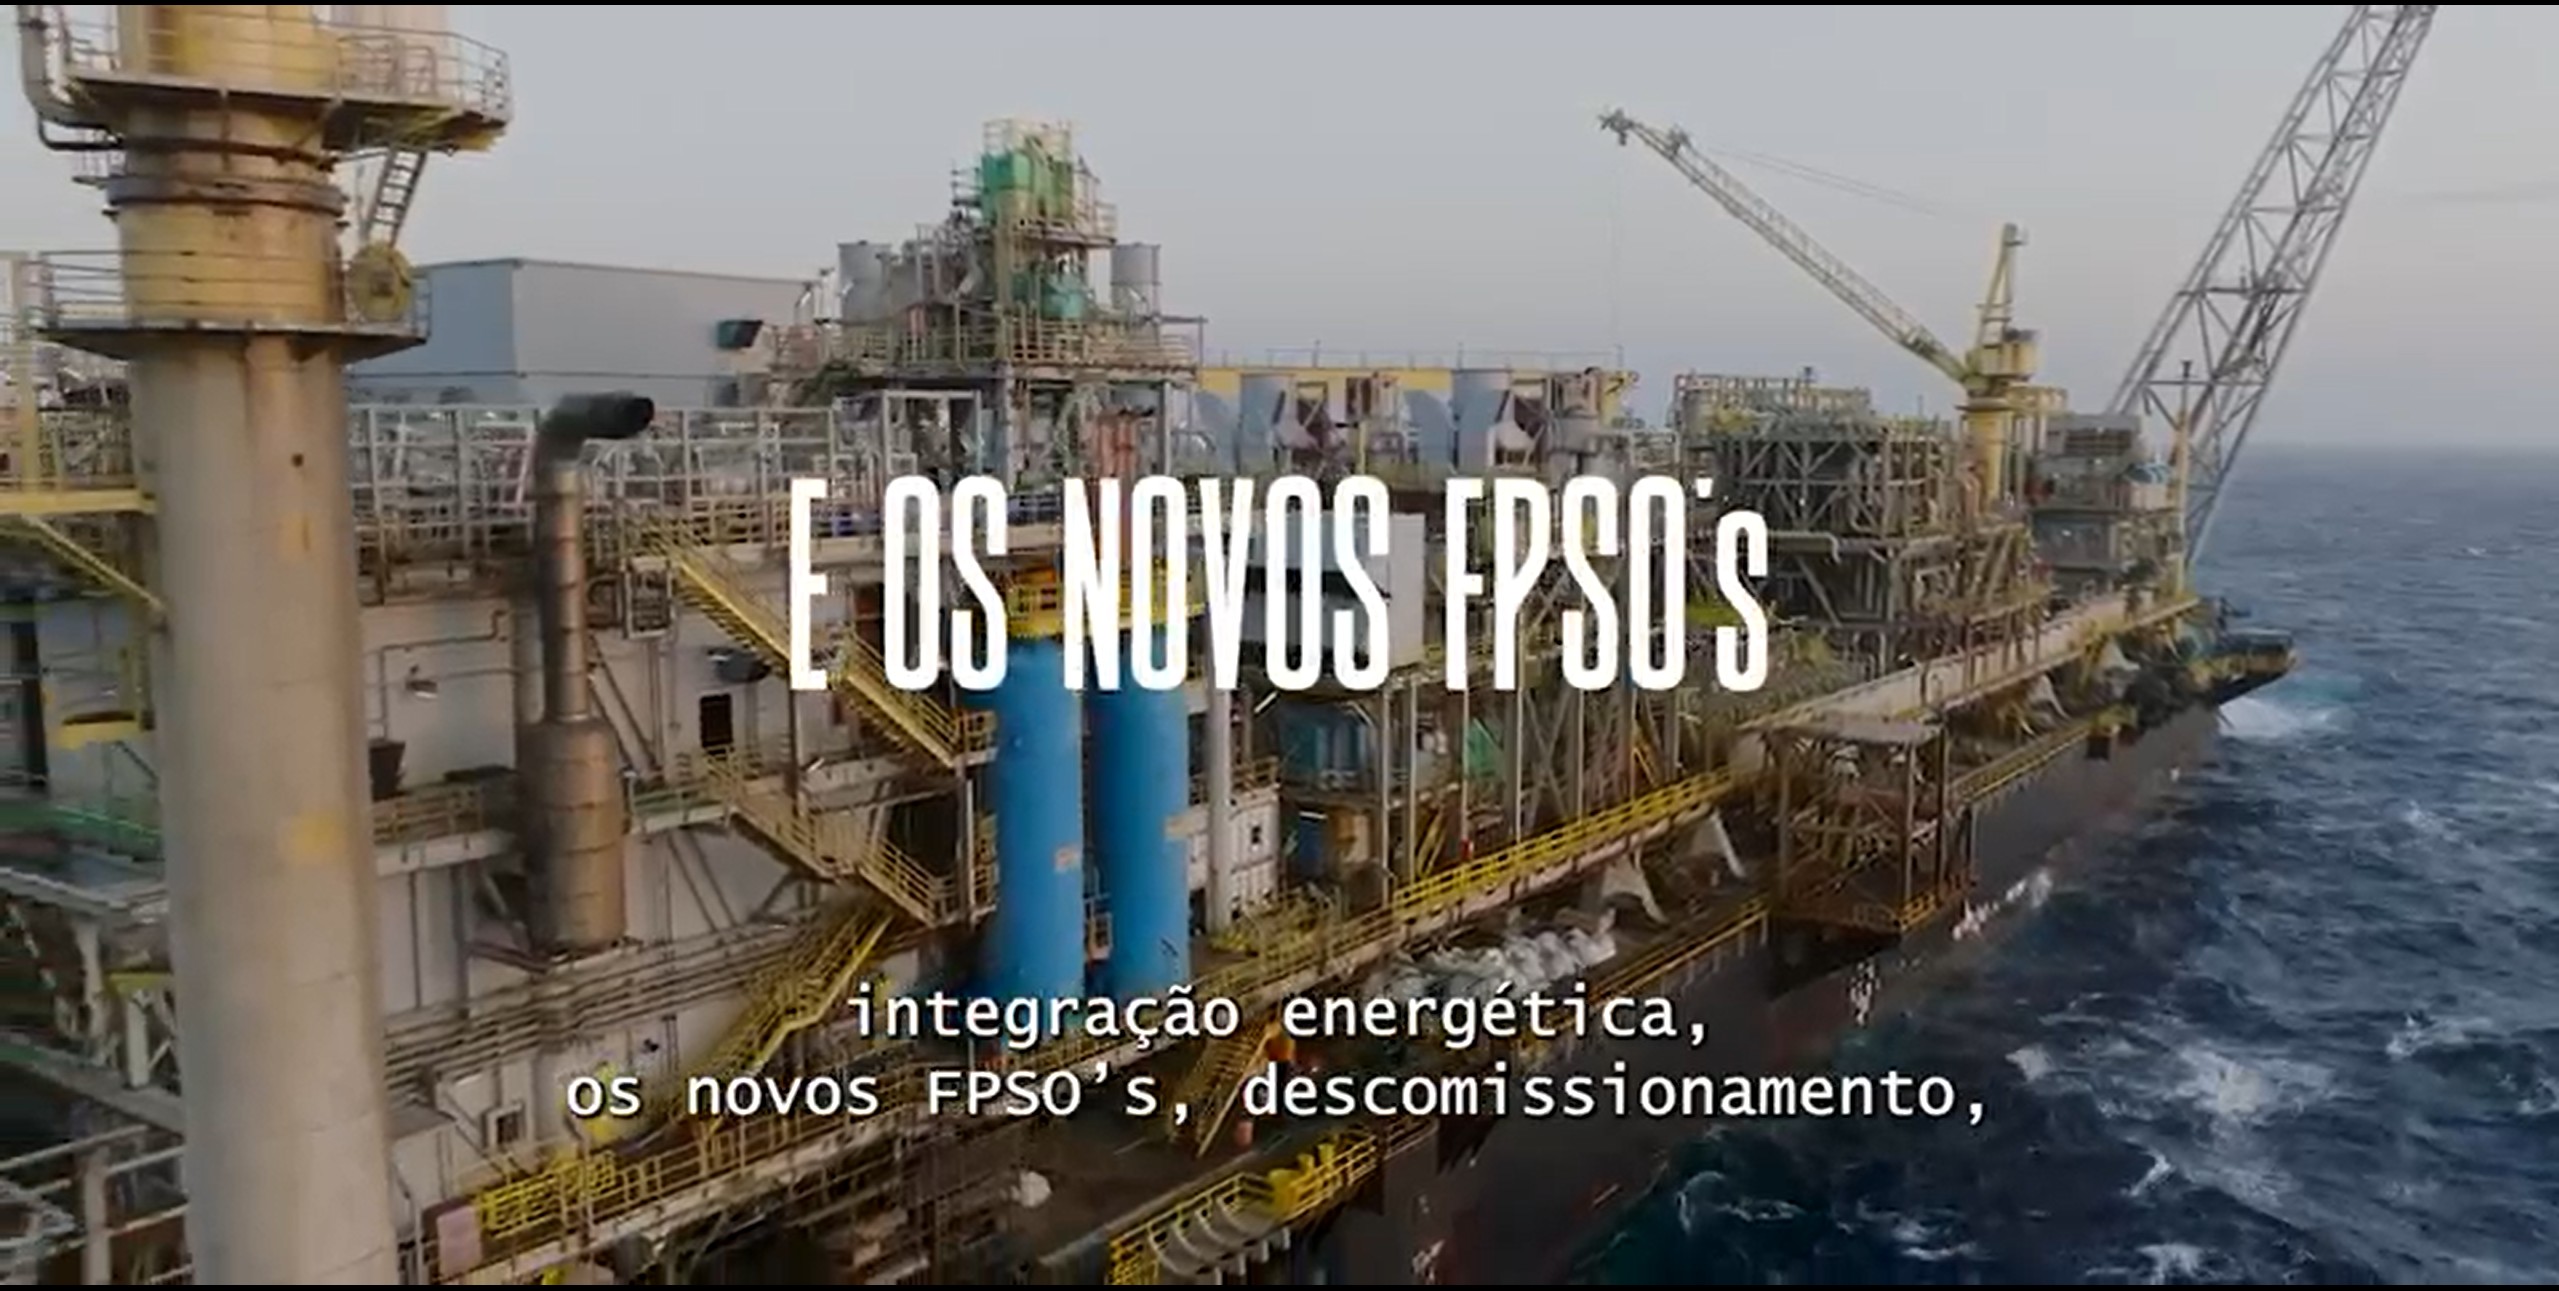
In the case of methane, the study in Science used the GHGSat constellation to estimate global emissions from point sources in the energy sector, including facilities associated with oil and gas and coal.
The publication describes the detection of emissions at thousands of locations and presents the total of 8.30 ± 0.24 million tons per year, linked to the 3,114 sites identified.
GHGSat is a private initiative with satellites dedicated to greenhouse gases; technical descriptions published in scientific and institutional channels indicate that the mission uses spectrometer-type sensors to measure gas abundances in the atmospheric column.

According to ESA’s description, the constellation included 13 satellites in June 2025, cited as the largest set dedicated to greenhouse gases.
This type of observation is particularly relevant because methane is a greenhouse gas and can be emitted from specific points along production chains.
The study operates on the logic of “detectable emitting points” by satellite, which shifts part of the debate from national and sectoral averages to a more granular level, where emissions can be quantified and compared between locations.
Sentinel-5P and TROPOMI: Daily Scan of NO₂, SO₂, and CO
On another end of monitoring, the Sentinel-5P was designed to observe the atmosphere’s composition with high frequency.
Within the Copernicus ecosystem, the mission is described as dedicated to atmospheric monitoring, aiming to provide daily global observations of constituents relevant to air quality, ozone layer, and climate; among the products are columns of nitrogen dioxide (NO₂), sulfur dioxide (SO₂), and carbon monoxide (CO), in addition to other gases and information on clouds and aerosols.
In practice, Sentinel-5P functions as a “map of the air” updated on a daily basis with global coverage.
Institutional information from Copernicus indicates that the satellite globally measures gases such as NO₂, SO₂, and CO, in addition to methane and formaldehyde, generating a publicly available database widely used by researchers and environmental monitoring services.
The relationship of these gases with urban and industrial pollution explains part of the interest: NO₂, for example, is often treated in scientific studies as a good indicator of air quality in urban and industrial areas, and TROPOMI itself appears in the literature as an instrument capable of providing daily measurements of NO₂ in the tropospheric column.
How the Satellite Transforms Gases into Atmospheric Data
This satellite monitoring does not amount to “static photos”.
TROPOMI is described by data institutions as an imaging spectrometer that provides daily global measurements through passive remote sensing, using solar radiation reflected and emitted by the Earth and its atmosphere—a process from which products used in atmospheric analysis are derived.
The usefulness of these series also appears in peer-reviewed works that use Sentinel-5P to observe changes associated with variations in human activity.
An article in Atmospheric Chemistry and Physics, for example, described reductions in NO₂ columns observed by Sentinel-5P across multiple continents during mobility restriction measures, with percentage declines in megacities reported within a broad range.
Global Panorama and Focus on Emitting Points
When the data are interpreted together, an important contrast emerges: Sentinel-5P delivers a global and daily view of gases related to air quality, while higher-resolution constellations can target specific sources and estimate emissions at the installation level, as in the case of methane analyzed in the Science study.
The coexistence of these two “modes” of observation—global panorama and focus on points—helps explain why atmospheric maps have begun to circulate not only in academic settings but also on public visualization portals and in environmental monitoring routines.
With this, air pollution ceases to be merely a problem measured by ground stations and begins to have a layer of continuous tracking on a planetary scale, with products that can be compared between cities, regions, and countries.
By transforming invisible gases into observable information, these systems reinforce the trend of treating emissions and air quality as monitorable phenomena in near real-time, with replicable and standardized evidence.
In your region, what type of pollution would you like to see mapped from space—and for what concrete reason would that make a difference in your daily life?


-

-

-

14 pessoas reagiram a isso.