 Portuguese
  English
  Spanish
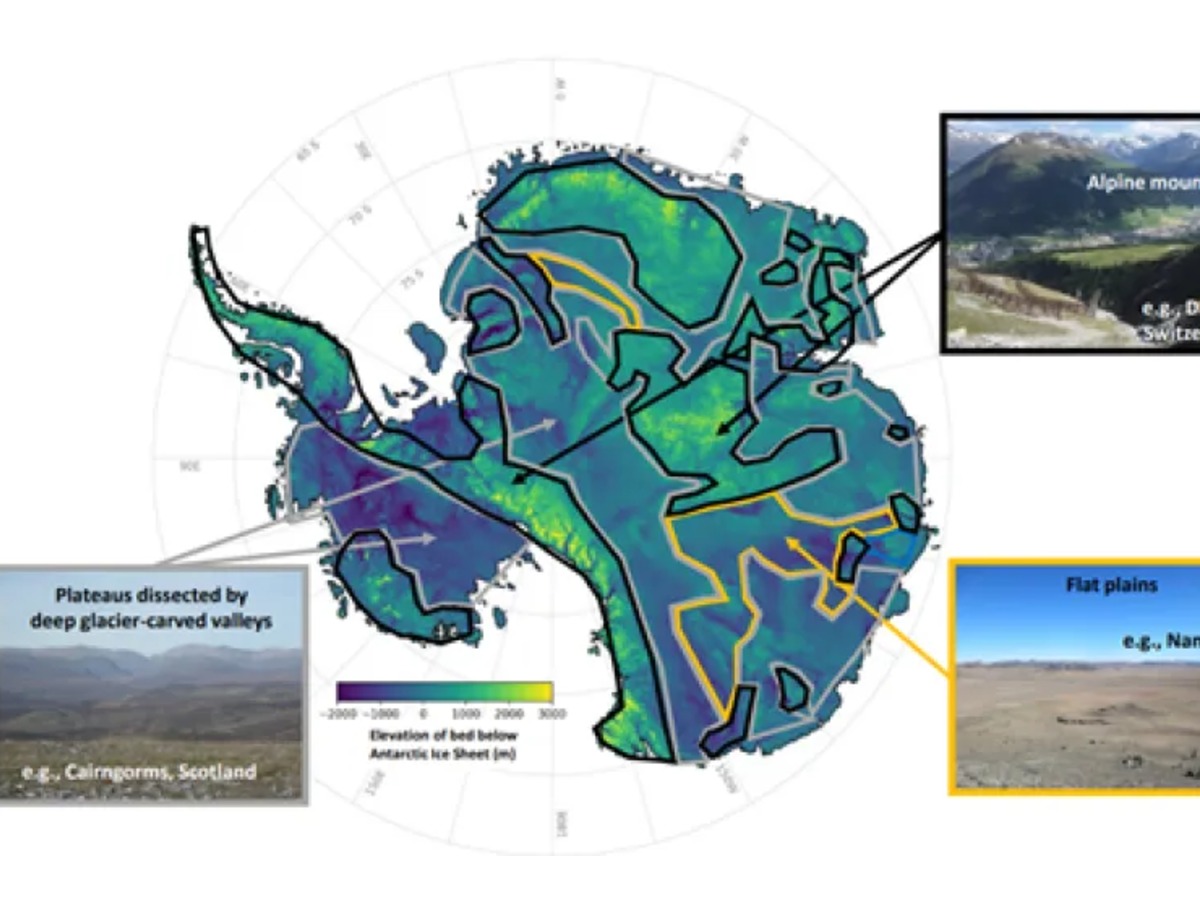
New Map Reveals Hidden Topography Below Up to Five Kilometers of Ice and Helps Scientists Understand How Antarctica May Influence Sea Level Rise
An international study revealed new details about Antarctica, showing for the first time a more accurate map of the topography hidden beneath up to five kilometers of ice. The research helps to understand how Antarctica may respond to climate change.
How Scientists Mapped the Interior of Antarctica
Antarctica plays a crucial role in the planet’s climate system. The continent holds about 90% of all the ice on Earth and approximately 70% of the world’s fresh water.
Despite this global importance, much of Antarctica remains poorly understood. The thick ice layer makes it difficult to directly observe the rocky terrain that exists beneath the frozen surface.
-
Dozens of Chinese research ships are discreetly mapping the ocean floor in three oceans – and naval analysts see a military pattern.

-
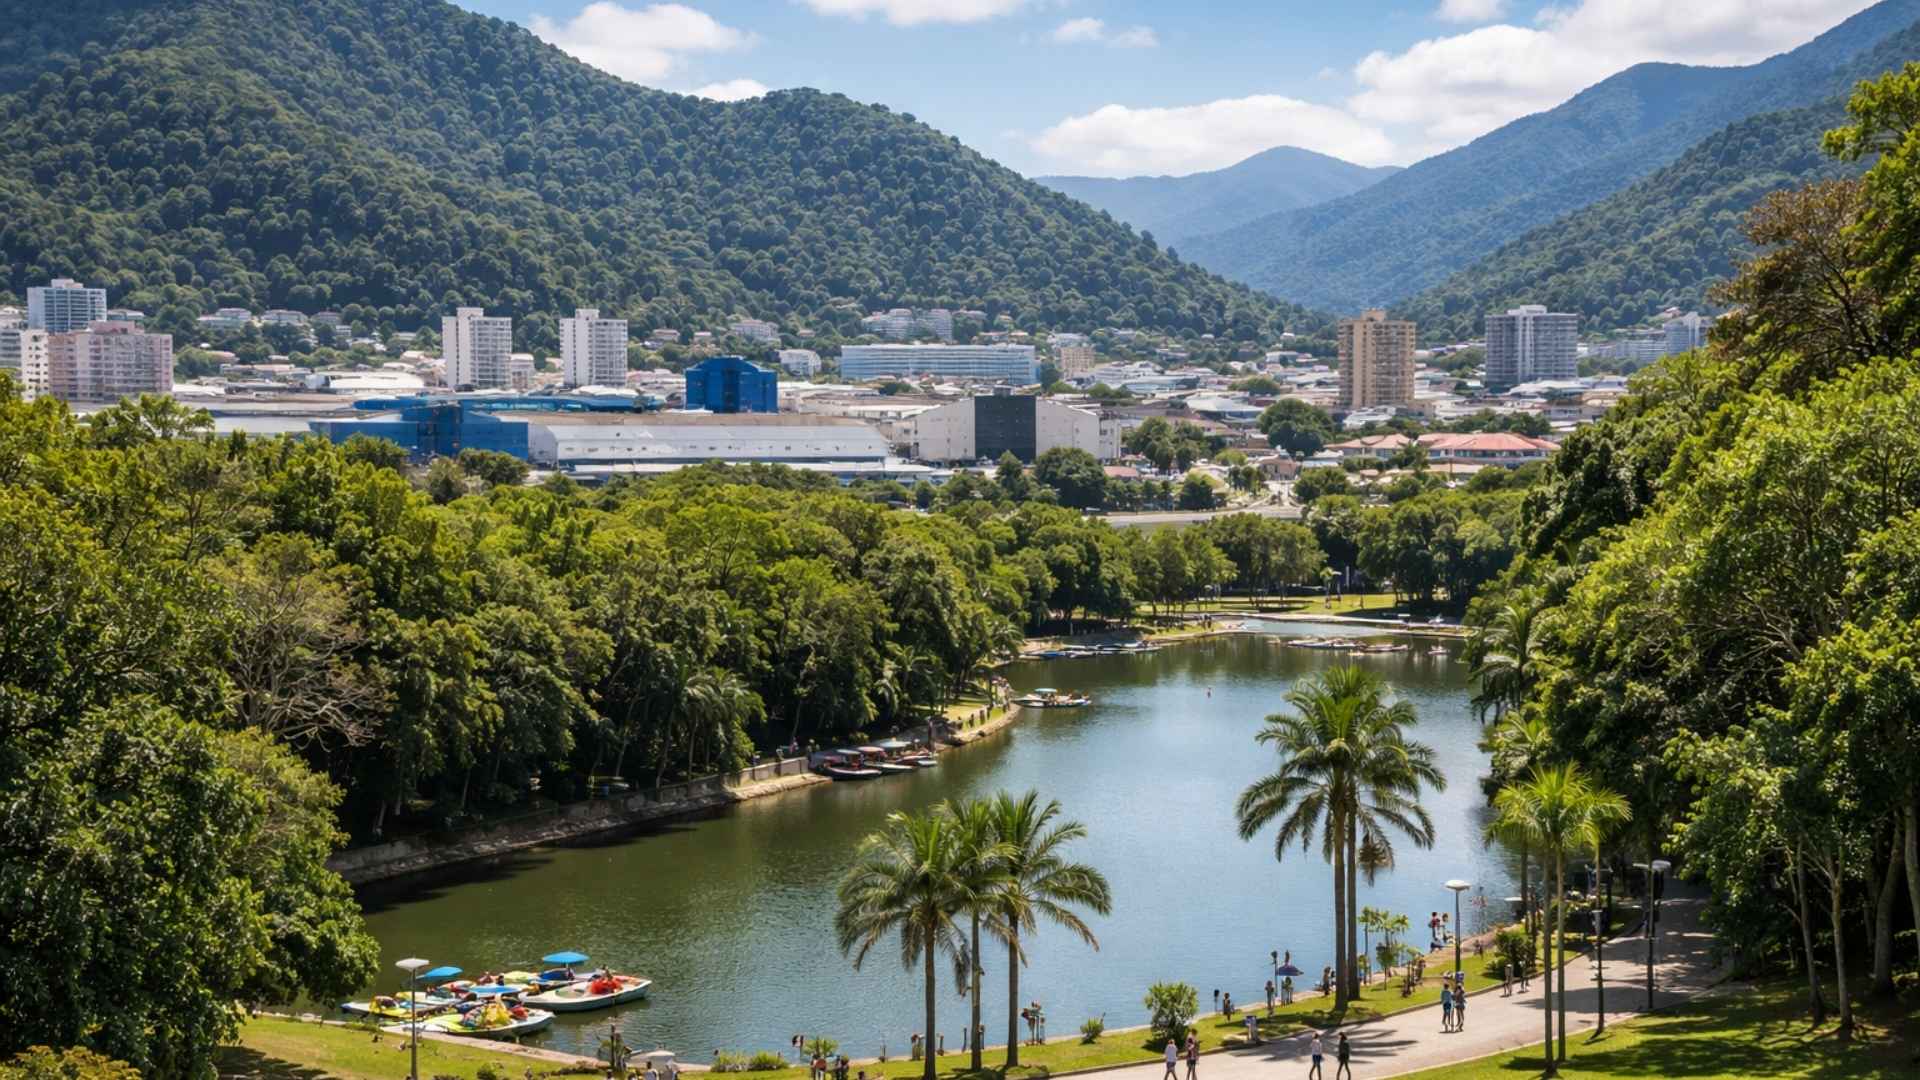
The winter of 2026 in Brazil will not be what you expect: meteorologists warn that the season will be warm and rainy at the same time due to the advance of El Niño, which is already warming the Pacific and changing the climate of the entire country.

-
For the first time, humanoid robots will compete in a full half-marathon without any human assistance in Beijing, with over 100 teams from China registering machines that need to complete the course with autonomous navigation on two legs.

-
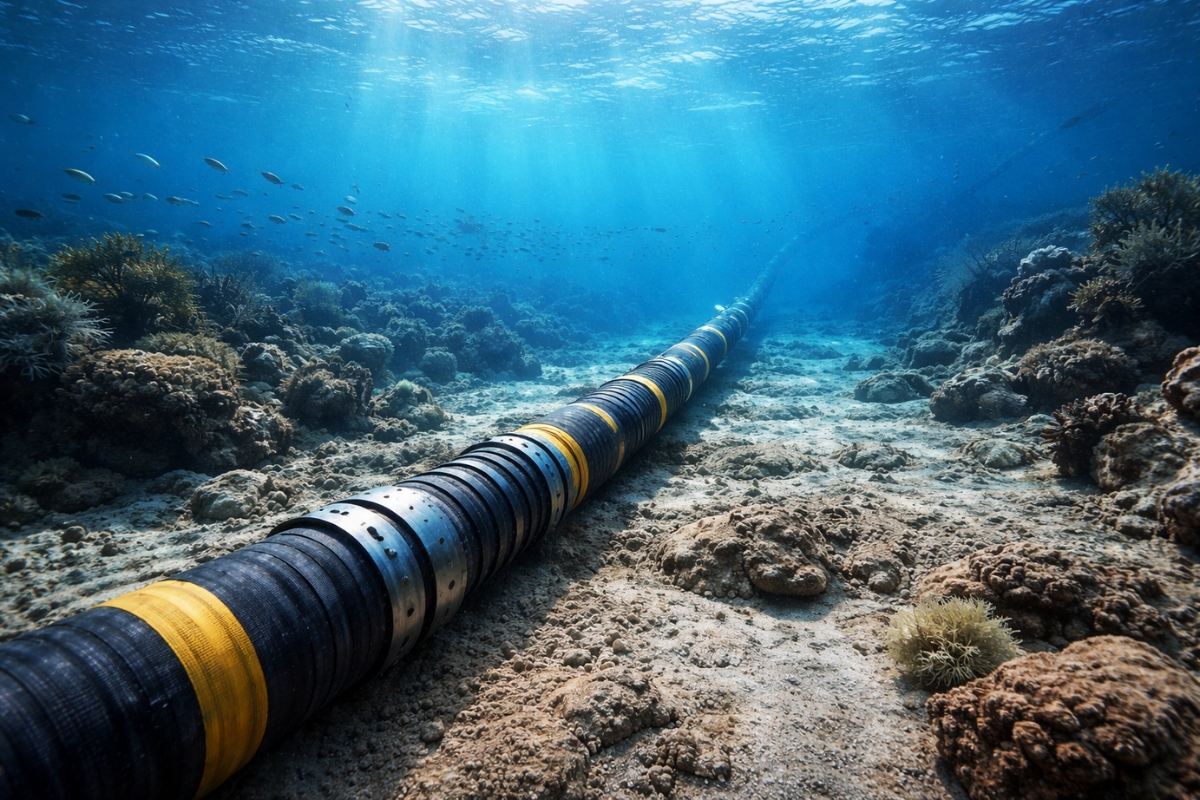
Submarine cables installed to transmit the internet now also help scientists detect earthquakes.

An international team led by researchers from the University of Edinburgh, in the United Kingdom, has made progress in this scientific challenge. The work was published in the journal Science and presents a new map of the subglacial topography.
To produce this result, scientists combined satellite data with a method to analyze the behavior of ice as it moves across the continent.
The technique used is called Ice Flow Perturbation Analysis, known by the acronym IFPA.
Technique Uses Ice Movement to Reveal Hidden Topography
The method is based on a fundamental observation. When a large mass of ice slides over mountains, valleys, or hidden canyons, small ripples appear on the surface of the ice.
These deformations are nearly imperceptible but can be detected by satellites that monitor the height and speed of the ice in different regions of Antarctica.
From these small variations, researchers applied physical models to deduce what type of geological formation exists beneath the frozen layer.
According to researcher Helen Ockenden, who led the study, this approach allows for the analysis of hidden topography without the need to drill into the ice.
Deep drills and radar flights had been previously used, but these techniques are expensive, time-consuming, and only cover small areas of the continent.
The new method allows for the analysis of the terrain on a much larger scale and identifies structures that previously did not appear in existing maps.
Map Reveals Much More Complex Landscape
The data obtained show that the subglacial topography of Antarctica is much more varied than indicated by previous surveys.
Among the identified structures are mountain ranges, deep valleys similar to those found in the Alps, and plains that have been eroded over time.
Large ancient river channels and thousands of hills and depressions that had never been recorded before were also detected.
Many of these formations have dimensions ranging from 2 to 30 kilometers. They belong to an intermediate scale of topography, too large for local studies and too small for the broad methods used previously.
These structures directly influence the behavior of ice on the continent.
Topography Influences Glacier Speed
Mountainous or irregular surfaces can act as a natural brake for ice movement.
By increasing friction between the ice and the rocky terrain, these regions slow down the movement of glaciers toward the ocean.
Meanwhile, smoother areas allow the ice to slide more easily.
This difference influences the speed at which ice masses can move as the climate warms.
Consequently, this affects the rate of sea level rise around the planet.
The ice layer of Antarctica has an average thickness of about two kilometers, potentially reaching nearly five kilometers in some areas.
Even a small fraction of this ice reaching the ocean can have significant impacts on coastal regions worldwide.
New Map Helps Climate Models
With more detailed maps of the bedrock of Antarctica, scientists can improve models that attempt to predict how the continent will respond to global warming.
This information helps to understand how the ice may move in the coming years.
The researchers themselves point out that the map produced still does not represent a perfect view of the Antarctic subsoil.
The method used has limitations and cannot capture the smaller structures of the topography.
Still, the study represents a significant advancement for the understanding of Antarctica and may guide future scientific missions and geophysical surveys on the continent in the coming years.
With information from Xataka.


-

Uma pessoa reagiu a isso.