 Portuguese
  English
  Spanish
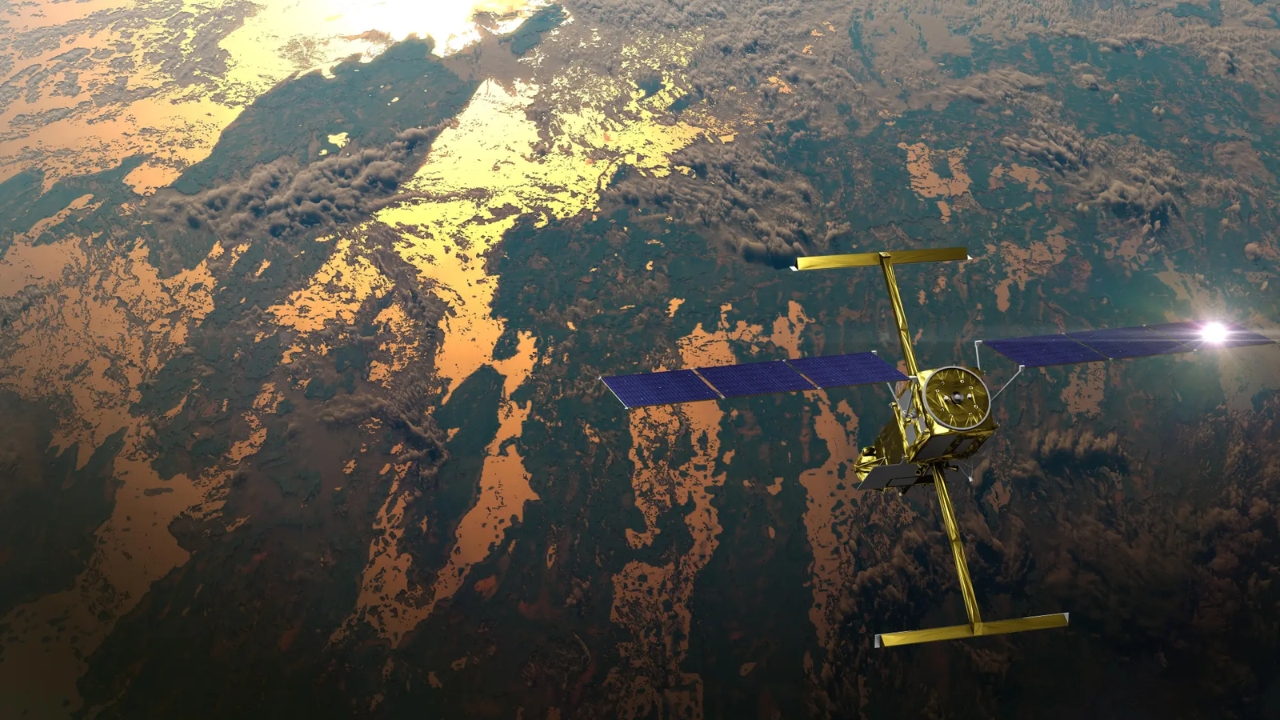
With measurements taken from space, the SWOT satellite reveals that the planet’s rivers have varied differently than expected, challenging old estimates and exposing new clues about extreme droughts and water behavior on Earth
A space mission led by NASA and France has opened a new window to understand the behavior of rivers around the world. For the first time, scientists have been able to track, month by month, how large waterways increase and decrease throughout the year with an unprecedented level of detail.
The data shows that the fluctuation in the volume of global rivers was smaller than previous estimates based on models indicated. The discovery has caught the attention of researchers and may change the way science monitors droughts, floods, and the impact of climate change on water resources.
What the SWOT satellite was able to observe
Launched in 2022, the SWOT satellite was created to observe Earth’s water with high precision. Unlike previous missions, it is not limited to oceans: it can also monitor almost all major lakes and rivers on the planet.
-
Amazon is moving forward with the discontinuation of old Kindles, directly impacting users; discover an effective alternative that allows you to maintain access to digital books and avoid immediate replacement of the device.

-
The global space economy has surpassed $613 billion and is expected to reach up to $1.8 trillion by 2035, but 78% is already dominated by the private sector, and the explosive growth comes from satellites that operate daily on Earth while rockets take off only occasionally.

-
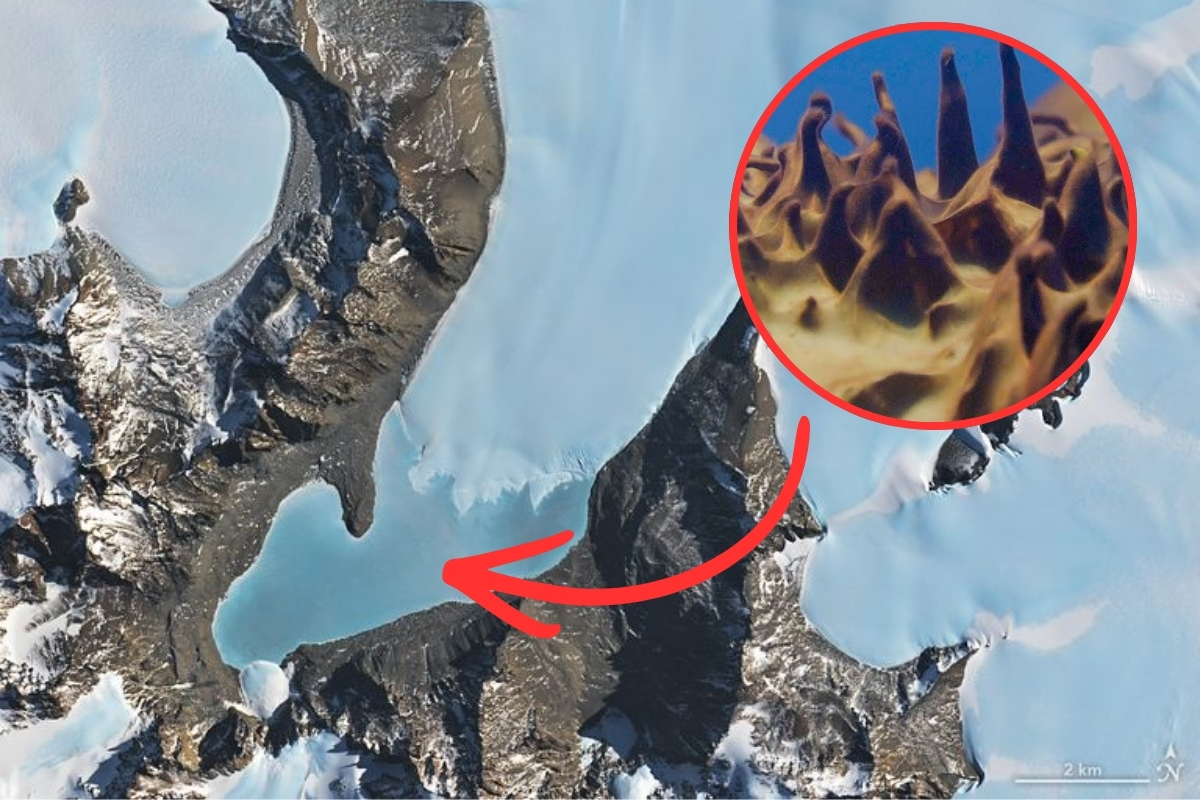
A lake in Antarctica hides water with rare chemistry, a depth of nearly 170 meters, and microbial structures that help scientists search for signs of life on Mars.
-
Elon Musk is trying to transform Starlink into the new standard for in-flight Wi-Fi, and the orbital war between giants is changing the sky of commercial aviation.

Although the equipment does not directly measure the absolute volume of water in each river, it records important changes such as width, surface height, and flow slope. With this, researchers can create a much more accurate picture of river dynamics over time.
More comprehensive measurements than old methods
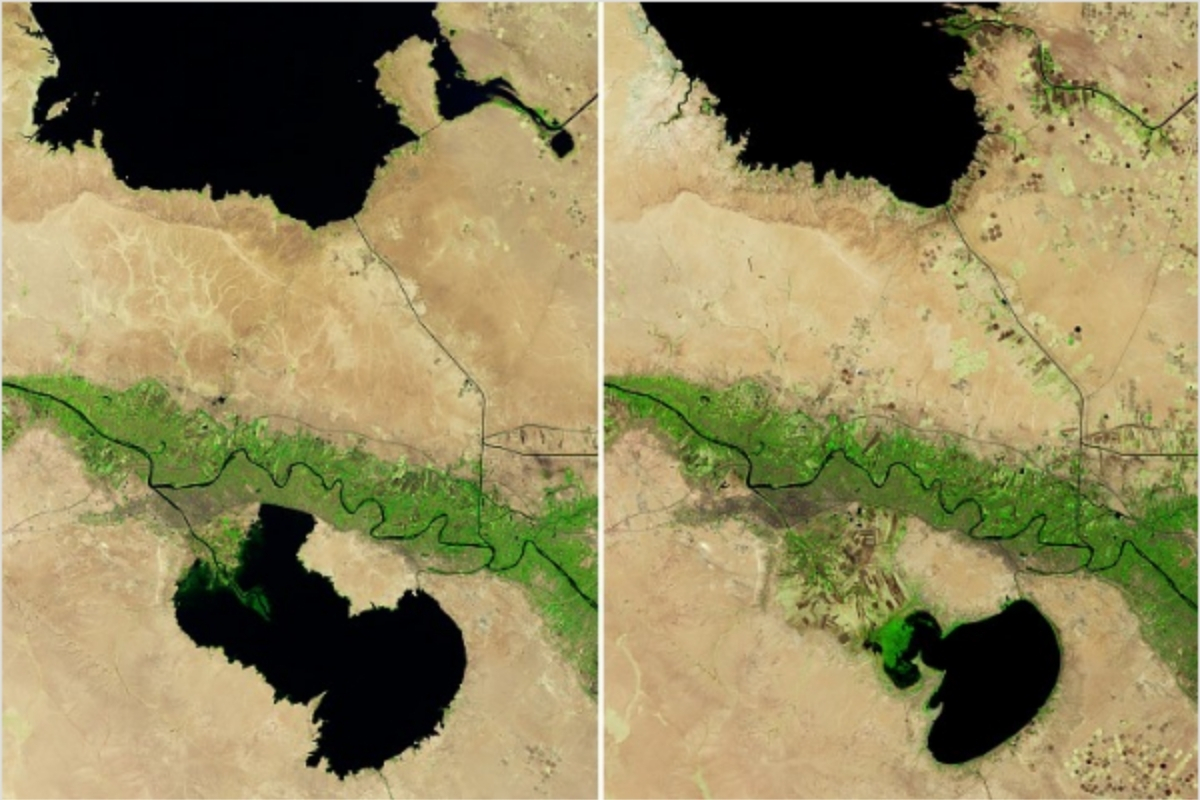
NASA’s Scientific Visualization Studio
For many years, hydrologists relied on mathematical models or a combination of different types of estimates to calculate the variation of water in rivers. The problem is that these methods brought larger margins of uncertainty, especially in remote areas or with little monitoring infrastructure.
With SWOT, the width and height of the water are measured almost simultaneously by an extremely sensitive radar instrument. This improves the accuracy of analyses and helps reduce errors that were common in previous surveys.
What the global numbers revealed
Scientists analyzed about 1.6 million observations made by the satellite. The survey tracked approximately 127,000 river segments between October 2023 and September 2024.
In total, the volumes varied by about 313 cubic kilometers of water. This total represents a fluctuation approximately 28% smaller than the smallest previous estimate available. For researchers, this result may have been strongly influenced by the historic drought recorded in the Amazon during the analyzed period.
Amazon leads the biggest changes of the year
Even facing an extreme drought, the Amazon River showed the greatest variation over the year. According to the data, it gained and lost about 172 cubic kilometers of water during this period.
To give an idea of the scale, this would be enough to cover the entire state of California, in the United States, with more than 30 centimeters of water. This data reinforces the size of the Amazon’s influence on global water balance and shows how extreme events can alter planetary outcomes.
Nile River surprises by varying less than expected
If the Amazon drew attention for the size of its fluctuation, the Nile stood out for the opposite. The longest river in the world showed a much smaller variation than many experts imagined.
The volumes changed by about 8.5 cubic kilometers over the period. Possible explanations include the presence of upstream dams, severe drought conditions, and also the natural challenges of interpreting data from a still relatively new space instrument.
Technology helps to see the bottom of rivers
In addition to tracking floods and ebbs, the mission is also helping researchers visualize something difficult to map in the field: the shape of river channels, including banks and submerged beds.
This type of information is valuable for various areas. It can contribute to navigation planning, improve flood forecasts, and enhance understanding of how water circulates through the Earth’s system. In many parts of the world, this underwater relief was still little known.
Large rivers show marked differences in water level
The new data shows that river channels can have very distinct profiles, ranging from more concave to more convex shapes, from stable sections to highly variable regions. This helps explain why some rivers respond so differently to changes in climate and flow.
In rivers such as the Amazon, Mississippi, Orinoco, Yangtze, Ganges, Mekong, and Yenisei, the observed levels varied by more than 10 meters between peaks and low periods. This range reveals how dynamic rivers can be even within a single year.
Why this discovery is important
Researchers consider the results a first step in answering long-standing questions about how Earth’s rivers function. In many regions, there are no measuring stations, and there are channels so isolated that surveys by boat or on land are practically unfeasible.
With more detailed observations made from space, science can advance in understanding central themes such as flow velocity, the impact of rainfall and melting, as well as how water is distributed among continents, rivers, and oceans.


Seja o primeiro a reagir!