 Portuguese
  English
  Spanish
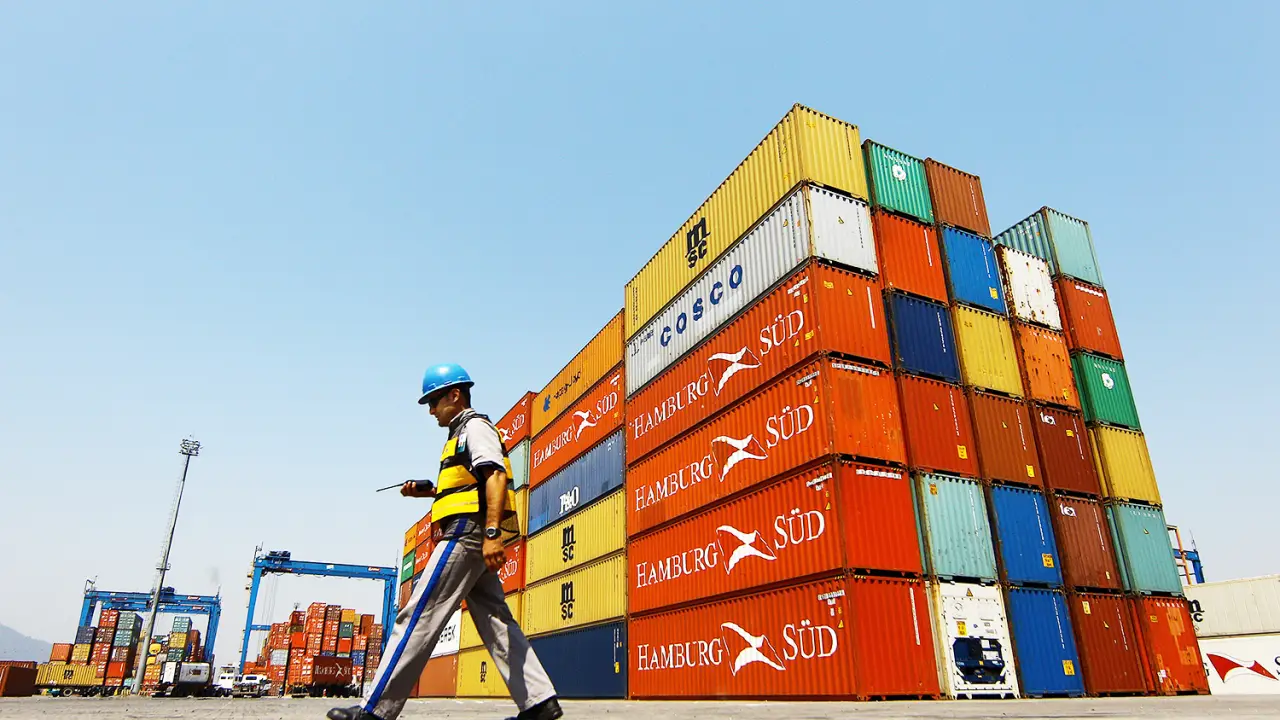
Recording a surplus of US$ 1.078 billion until the present moment of January, the Brazilian trade balance has export results reaching US$ 11 billion and imports at US$ 9.29 billion.
The main competitor in this trade was around US$ 20.29 billion. The Ministry of Development, Industry, Commerce and Services released the data about this surplus. The growth of exports in the second week of January 2023 was 16.8% compared to January 2022, causing imports to fall by 1.6%. Thus, the Brazilian trade balance recorded a surplus of US$ 1.71 billion, and its trade competitor increased by about 7.6%.
As of now in 2023, the performance of each sector was as follows: in Agriculture, growth was 17.1%, amounting to US$ 1.85 billion; in Extractive Industries, growth was 18.9%, reaching US$ 2.40 billion, and also 16.1% growth in the Manufacturing Industry, which increased to US$ 6.69 billion. All these combined results led to an increase in exports.
After the growth in sales of some products, the expansion of exports was significant, including: Rye and wheat, not ground (24.3%), Paddy or rough rice (167.2%) in the Agriculture sector; Some other raw minerals (318.7%), Copper ore and its concentrates (252.7%), Crude oil or minerals and crude (21.7%) in the Extractive Industry; Frozen, fresh or chilled poultry (46.9%), Molasses and sugars (67.8%), and Pig iron, sponge iron, spiegel, granules, steel, and iron alloys (59%) in the Manufacturing Industry.
-
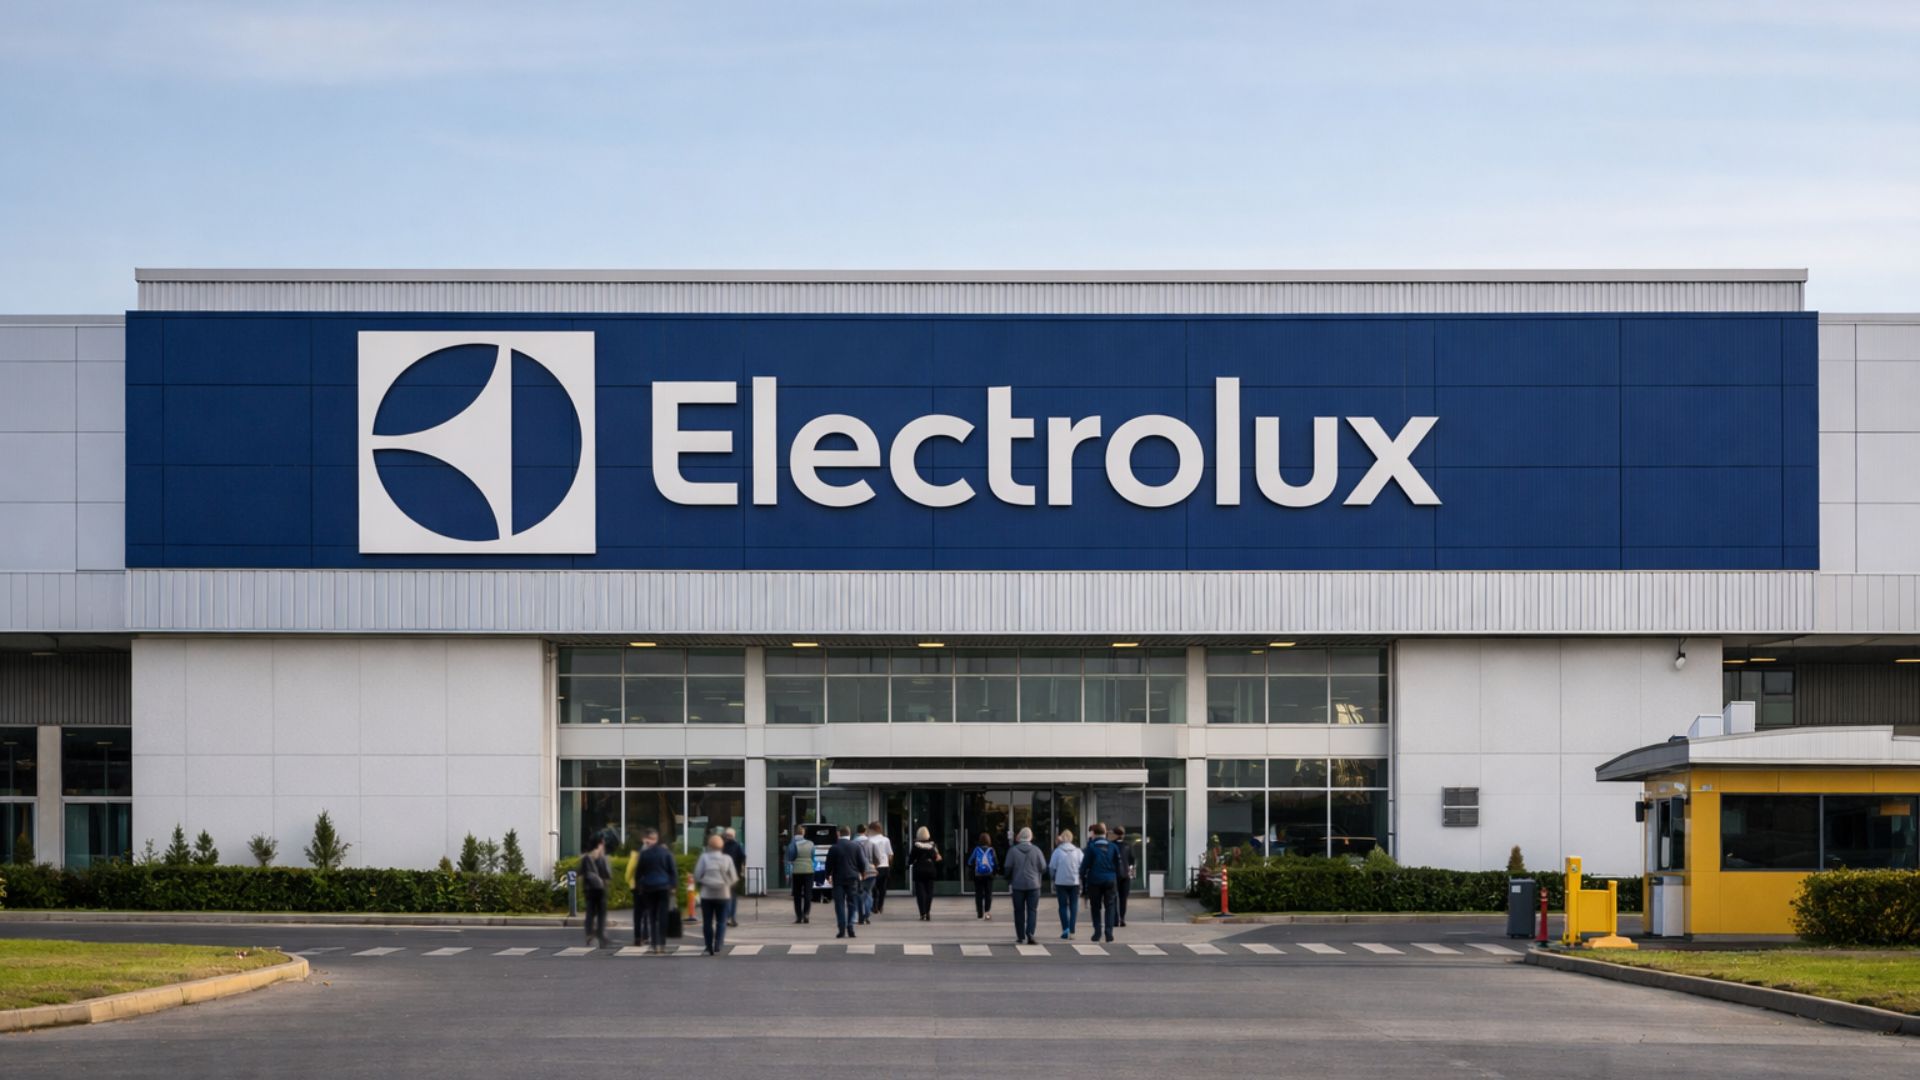
Electrolux surprises, closes colossal factory and lays off 400 people in a mass dismissal that will have a direct effect later this year, following a cost review, with an impact of R$ 272.5 million and R$ 109 million in cash in Chile.
-
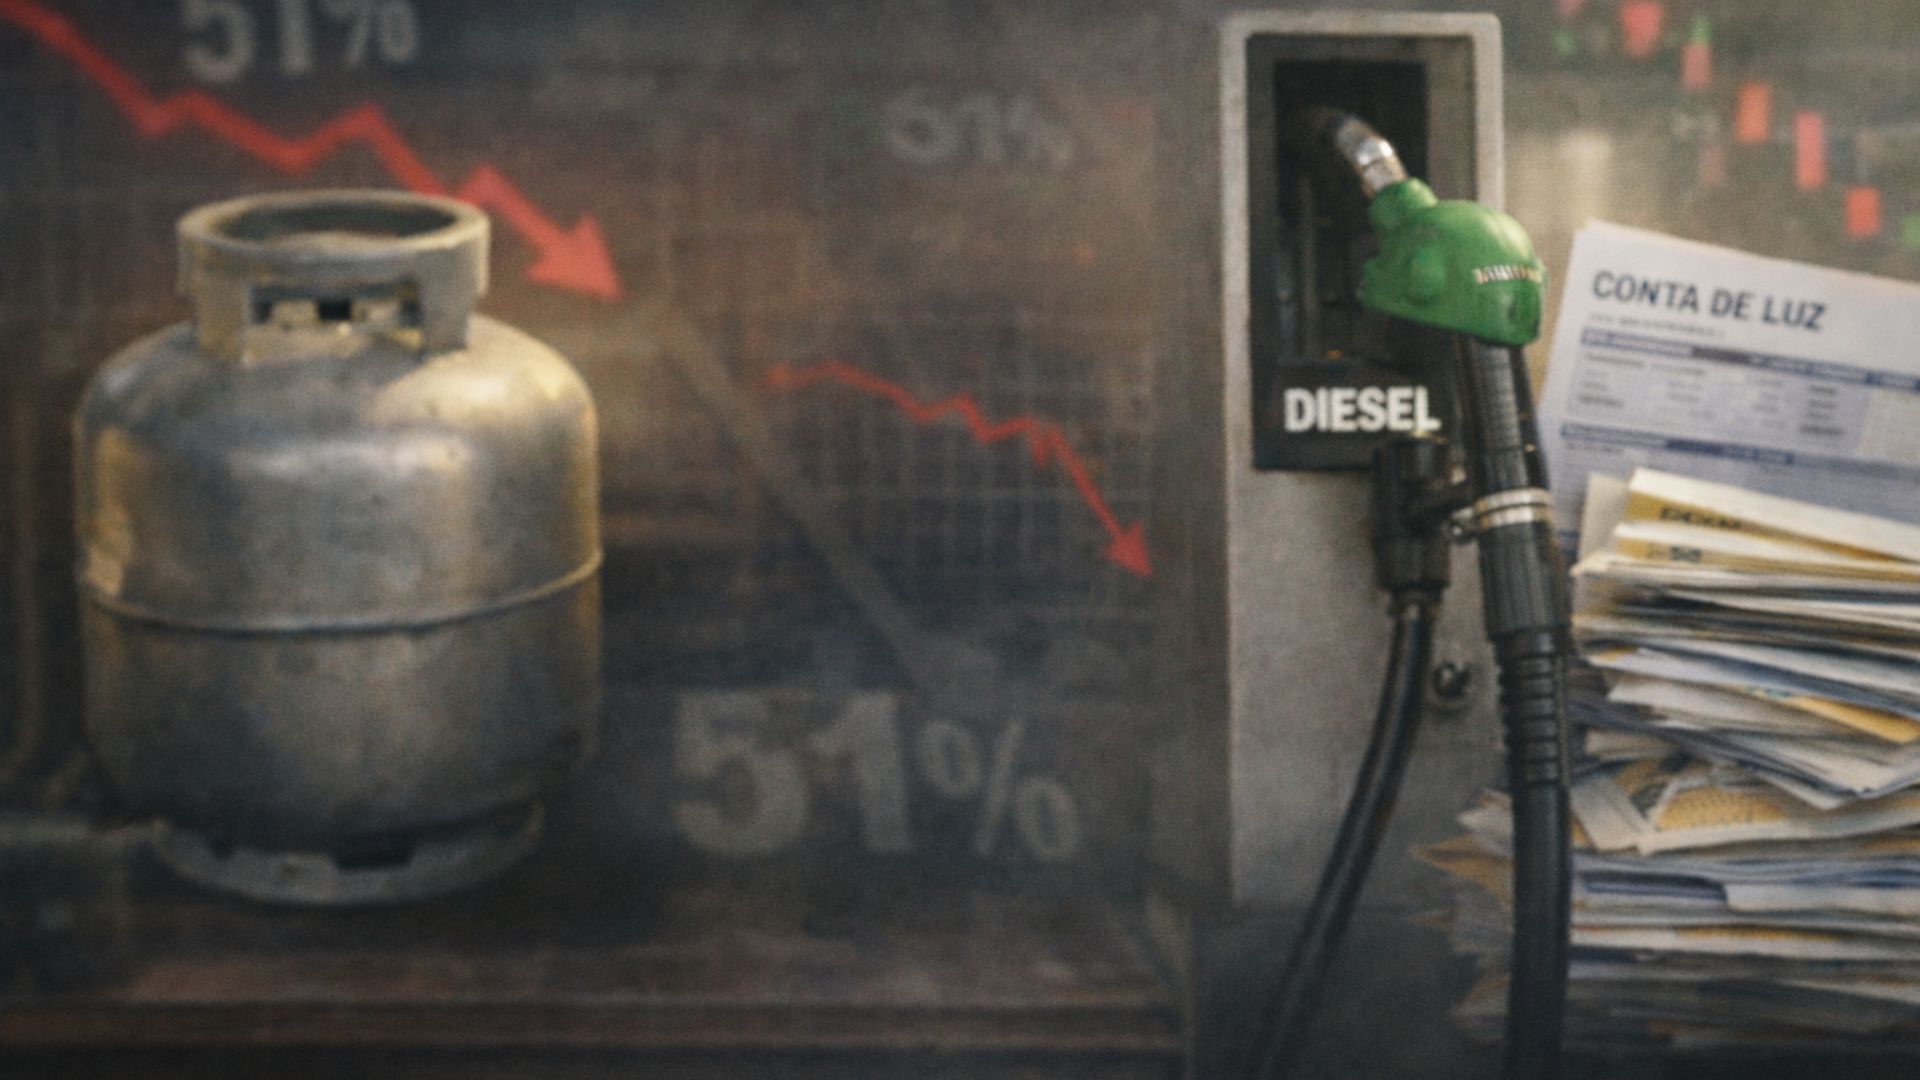
The Lula government is pursuing re-election and is therefore preparing a package with discounts of up to 80% on debts, subsidies for diesel, gas for 15 million, and energy, after reaching 51% disapproval six months before the election.
-
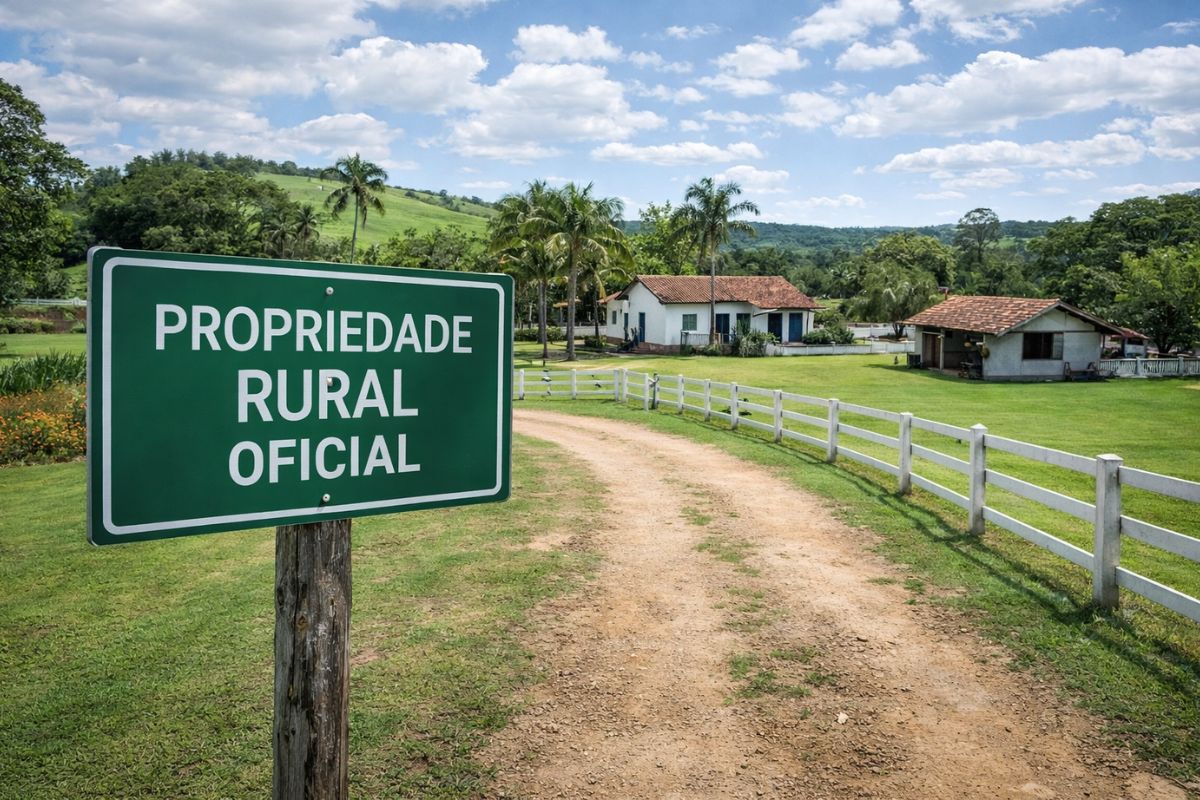
The chamber approves a project that transforms plots of up to 2,000 square meters into official rural properties, allowing thousands of small producers who were invisible to the government to now access credit, tax exemptions, and technical assistance.
-
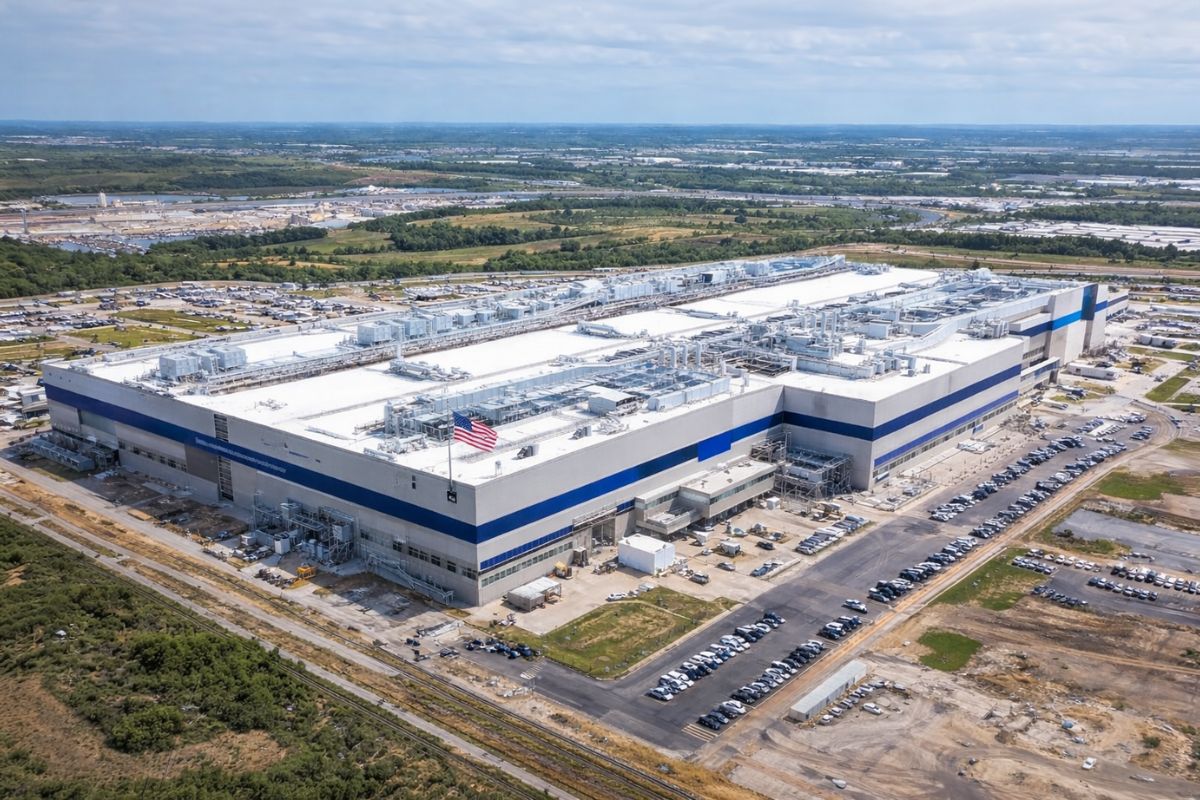
Factory 52, in the USA, cost over $5 billion, covers 270,000 square meters, and manufactures cutting-edge chips: it was named Project of the Year by the world’s largest engineering magazine, marking the global race for semiconductors.
Despite the growth in export results, the following products saw a decrease in their sales: Spices (-29%), Raw cotton (-20.7%), Soybeans (-47.5%) in Agriculture; Nickel ore and its derivatives (-66.1%), Iron ore (-0.6%), and Aluminum ore and its concentrates (-58.8%) in the Extractive Industry; Semi-finished and other forms of iron or steel (-20.2%), Non-laminated iron or steel products, or plated, or coated (-83.6%) in the Manufacturing Industry.
The performance of imports until the 2nd week of January 2023 by economic activity sector was as follows:
Agriculture saw growth of 24.0%, amounting to US$ 0.22 billion; with a decrease of -46.3% in Extractive Industries, reaching about US$ 0.63 billion, and finally, with growth of 5.8% in Manufacturing Industries, reaching US$ 8.42 billion. With this combination of results, the decline in imports was prompted.
The motivated decline in imports was influenced by the reduction in purchases of the following products: Unmilled corn, excluding sweet corn (-30.9%), Latex, rubber, gutta-percha, guaiule, chicle (-42.5%), Soybeans (-92.5%) in Agriculture; Nickel ore and its concentrates (-2.6%) Iron ore (-100%), Coal (-59.8%) in the Extractive Industry; Medicines and pharmaceutical products, excluding veterinary ones (-30.3%), Oils petroleum fuels (-15.2%), and Fertilizers, excluding raw ones (-10.9%) in the Manufacturing Industry.
Despite the decline in imports, the following products saw an increase: in Agriculture, Fresh or dried fruits and nuts (90.1%), Unshelled wheat and rye (19.8%), Unmilled barley (321.3%); in the Extractive Industry, Crude oil or raw minerals (79%), Raw fertilizers (141.5%), Copper ores and their concentrates (370.1%); Motor vehicles for the transport of goods (132.5%), Inorganic chemical elements, halogen salts, and oxides (73.2%), Passenger motor vehicles (88%) in the Manufacturing Industry.


Seja o primeiro a reagir!