





NASA’s 3D Geoid shows how gravity differences alter altitude reference and reveals Brazilian contribution to the model.
The NASA launched on July 15 an interactive visualization capable of showing how gravity establishes different reference heights around the planet. The model represents the geoid, a scientific surface used to determine altitudes and understand how the level of an ocean would be if subjected exclusively to Earth’s gravitational attraction.
Produced by the Scientific Visualization Studio, the content transforms more than 1 billion observations made by 19 satellites into a three-dimensional representation. Since the differences would be almost imperceptible given the Earth’s dimensions, the agency vertically amplified the result by 10,000 times.
Geoid shows a different Earth from the known relief
The bulges observed in the animation do not correspond to mountains. Similarly, the lowered areas do not identify valleys, marine abysses, or other crust formations.
-
Monarch butterflies receive solar-powered transmitters and now have their migration tracked in real-time.

-
Your miles now buy train tickets in Europe, with London to Paris starting at 9,400 points, Berlin to Frankfurt for 4,100, and access to over 12,000 destinations in 12 different countries.

-
Decades before GPS reached cell phones, the daughter of a family working on a farm programmed a giant supercomputer, calculated Earth’s deformations, and helped satellites accurately locate points.

-
New breakthrough from South Korea eliminates one of the biggest bottlenecks of green hydrogen with a catalytic layer that reduces losses in water electrolysis, increases energy efficiency, and could accelerate industrial adoption worldwide.



The shape of the geoid is related to the intensity of gravity in each region. The amount of mass inside the Earth is not distributed evenly, causing the attraction to be stronger in certain locations and less intense in others.
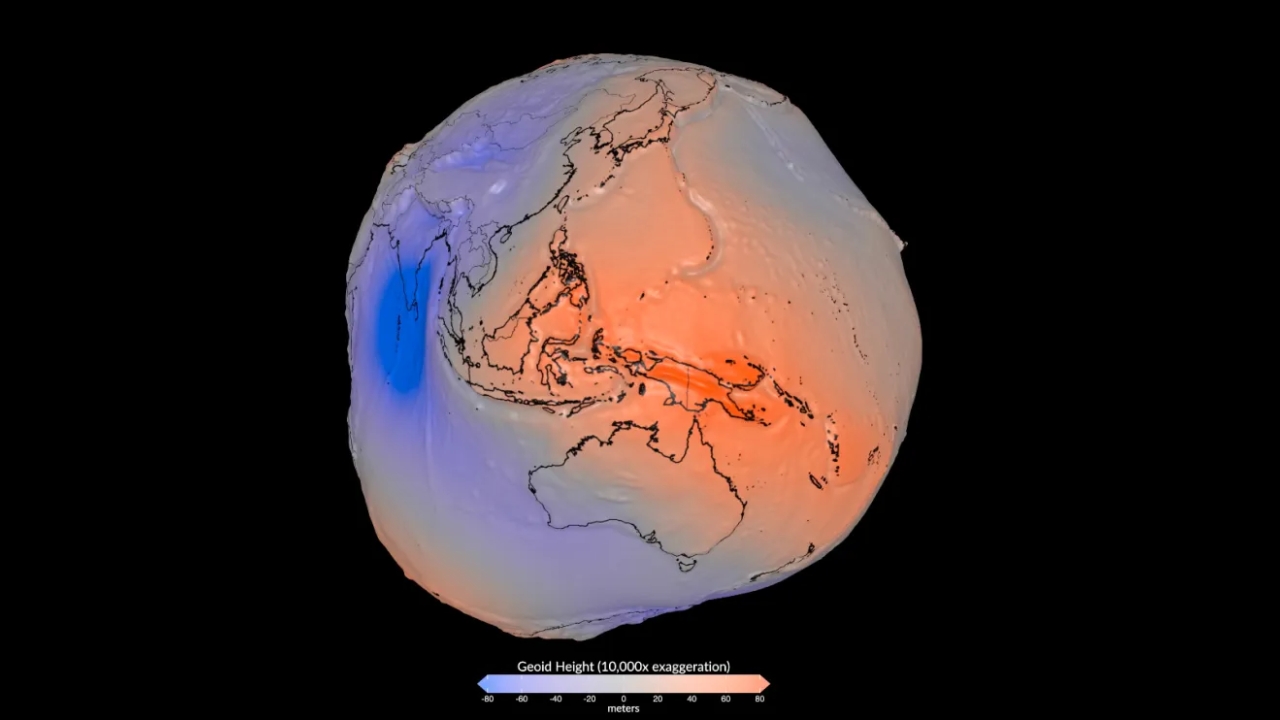
This difference modifies the height at which a liquid surface would reach equilibrium. To understand the concept, it is possible to imagine the planet completely covered by a still ocean, without the action of currents, winds, or tides.
The shape assumed by this imaginary mass of water would be the geoid. Instead of following a uniform sphere, its surface would present small elevations and depressions determined by changes in the gravitational field.
Geoid extremes are in Iceland and southern India
When the values are observed on a real scale, the highest elevation indicated by the model is in Iceland. At this point, the calculated surface is 85 meters above the adopted reference.
The opposite extreme of the geoid appears in southern India, where the difference reaches 106 meters below the same reference. These numbers are real, although the rugged appearance of the animation results from multiplying by 10,000.
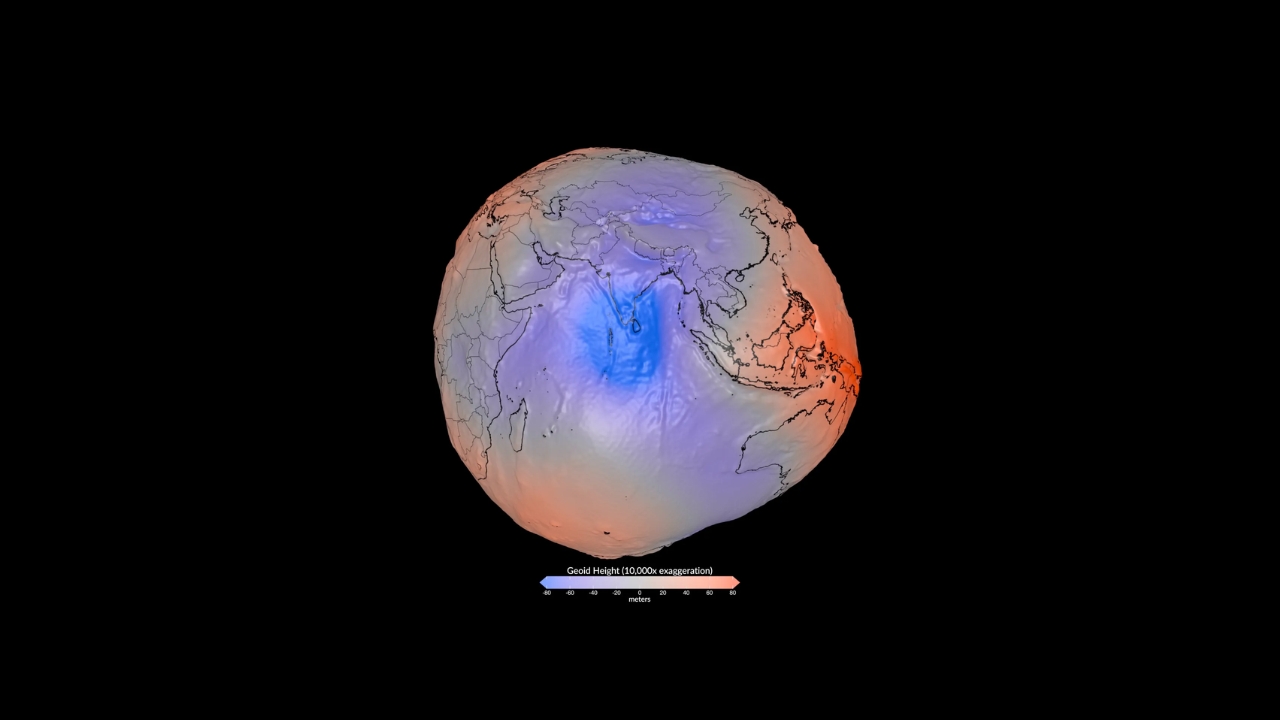
The amplification was necessary because a difference of tens of meters is very small when compared to the size of the entire planet. If the data were presented in natural proportion, the public would have difficulty distinguishing the variations.
Therefore, the image does not intend to reproduce the physical appearance of the Earth. Its purpose is to convert discrete changes of the geoid into shapes that can be identified during the exploration of the three-dimensional model.
Geoid establishes a common base for altitudes
The model has an application that goes beyond visual representation. It provides the surface used as a reference to determine the official altitudes within a territory.
The very idea of “sea level” depends on the geoid. The existing oceans do not remain still and are constantly affected by phenomena that alter their surface, which prevents the direct use of a single observed level as a standard for all regions.
In scientific definition, it is an equipotential surface. This means that any point belonging to it presents the same value of gravitational potential.
This equality allows distant places to be related to a common vertical reference. Thus, the geoid functions as a base to express heights without relying solely on the local and momentary position of sea water.
Brazil participated in the evaluation of the geoid
The work also used Brazilian information to check the correspondence between the global calculation and the measurements made on land. The Brazilian Institute of Geography and Statistics provided data obtained by leveling associated with GNSS.
The researchers compared the geoid results with this IBGE set. Equivalent bases from the United States, Germany, and Japan also participated in the comparison.
This stage did not create the gravitational field presented in the visualization, but served to verify the result produced by the model. The terrestrial measurements offered independent parameters for the evaluation of the calculated heights.
The presence of Brazilian data shows that the validation of the geoid was not limited to information collected in orbit. The work brought together spatial observations and references obtained in different territories.
More than 1 billion records formed the GOCO06s
The scientific base chosen by NASA was the GOCO06s, a planetary model of the gravitational field developed by the Gravity Observation Combination project. The responsible consortium brings together institutions from Switzerland, Austria, and Germany.
The GOCO06s was presented in 2021 in the scientific journal Earth System Science Data. According to the authors, the geoid was calculated from more than 1 billion observations accumulated over 15 years.
In total, 19 satellites provided information for the project. The set does not rely on a single mission nor on just one measurement technique, a characteristic that allows combining records produced in different ways.
Part of the information describes the average behavior of the gravitational field. Another portion allows the geoid to also incorporate changes recorded over time.
Satellites measured gravity with different techniques
One of the missions incorporated into the GOCO06s was the GOCE, conducted by the European Space Agency. The equipment carried a gradiometer, an instrument designed to measure derivatives of the gravitational potential.
The GRACE mission adopted another strategy to investigate the geoid. Developed in a partnership between NASA and the German Aerospace Center, the project operated with two satellites traveling together.
During the flight, the equipment recorded small changes in the distance between them. These changes allowed detecting differences in the gravitational attraction encountered along the orbit.
The model also considers trajectories of other satellites positioned at low altitude. Laser tracking conducted from the ground adds another source of information to the calculation of the geoid.
Combination reduces the limitations of each method
Each form of observation contributes a type of measurement and, at the same time, has its own constraints. Using only the gradiometer, the distance between satellites, or laser tracking would produce a more limited set.
The strategy of the GOCO06s was to bring these techniques together in the same model. According to the authors, the integration compensates for the individual deficiencies of the methods and allows achieving the spatial resolution necessary to represent the geoid.
The 15 years of data also extended the analyzed period. Instead of presenting just a snapshot of gravity, the result includes the average field and components related to temporal changes.
NASA’s visualization converts this scientific work into an accessible format. The user directly observes the differences in the geoid, even without dealing with the calculations used in the model’s development.
Geoid contributes to different scientific areas
Knowledge of the gravitational field has applications in research on plate tectonics. The observed changes help study the mass distribution associated with the Earth’s structure.
Oceanography also uses the geoid to analyze the seas from a reference determined by gravity. This allows separating the equilibrium surface from the effects produced by other oceanic phenomena.
Another purpose is in the approximation between national altitude systems. As different countries need to establish vertical references, a planetary model provides conditions to relate these measurements.
By gathering satellite observations, laser tracking, and terrestrial validation data, GOCO06s made it possible to represent an invisible component of the planet. The three-dimensional model published by NASA shows that the geoid does not describe the Earth’s relief, but the gravitational surface used to understand oceans, compare altitudes, and investigate Earth’s dynamics.
With information from CNN Brasil


