Portuguese
  Spanish
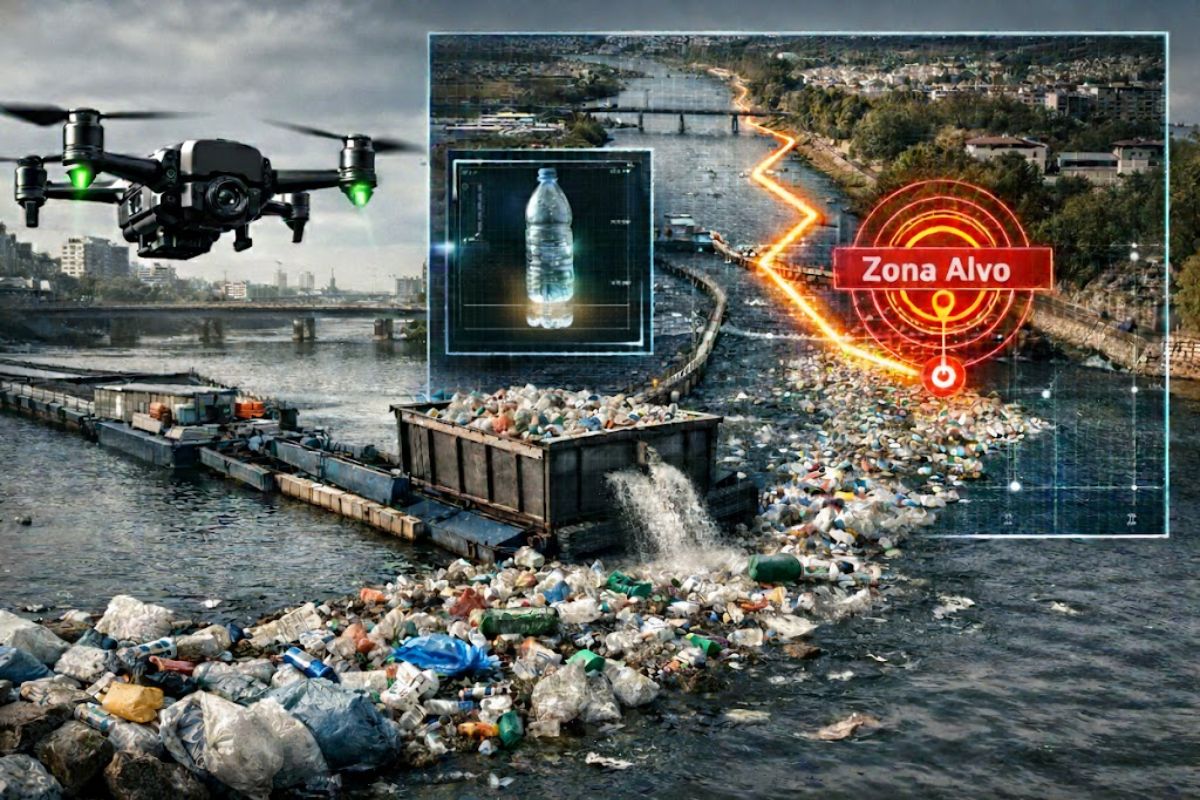
Combining Remote Sensing, Drifting Devices, and AI Modeling, the Smart River Survey Transforms Waste Combat into Measurable Strategy: Identifying Sources, Measuring Flows, Prioritizing Critical Points, and Guiding High-Impact Interventions, Reducing Plastic Entry into Rivers and the Ocean with Continuous Local Evidence.
The waste that escapes through drainage systems, urban streams, and rivers does not spread randomly: it follows patterns, timings, seasons, and routes that can be measured. It is precisely at this stage, before the installation of interceptors, that researchers from The Ocean Cleanup focus months of work to understand who pollutes, where waste is concentrated, and why certain stretches accumulate more plastic than others.
Rather than treating the entire city as a single block, the Smart River Survey reads each basin as its own system. The methodology combines drones, artificial intelligence, GPS trackers, and local research to transform a diffuse problem into operational diagnostics. The result is a decision map that guides interventions with greater capacity to cut the flow of plastic pollution before it reaches the ocean.
What Makes the Smart River Survey Different in Addressing Urban Waste
The main change lies in the logic of action: it starts with diagnosis, not construction. In complex urban environments, where waste varies by neighborhood, type of occupancy, rainfall regime, and infrastructure condition, decisions based solely on perception tend to waste resources. The Smart Survey emerges to reduce this noise and organize priorities based on evidence.
-
Brazil Secures Second Place at WorldSkills 2024 in Lyon, with 64 Young Professionals and 8 Medals, Including Gold from a Rio de Janeiro Hairdresser

-
3,000 Military Personnel from 10 Countries, Including US and Chinese Marines, Train Together in Brazil’s Savanna: Operation Formosa Becomes Largest Naval Ground Exercise Before First Cancellation Since 1988
-
UAE Sends 110 Date Palm Trees to Brazil, Signs $4 Million Deal to Boost Date Production in Bahia’s Hinterland, with Presidential Palace Receiving 10 Saplings
-
The Day the Soviet Union Forfeited Against Chile, Leading to an Uncontested Goal and a Spot in the 1974 World Cup


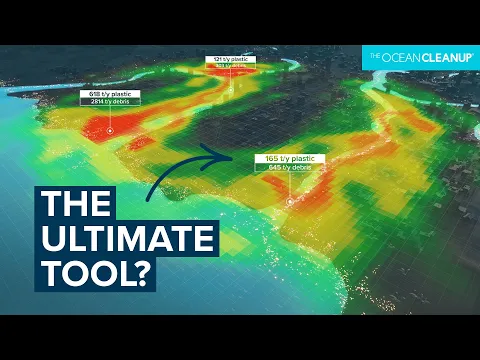
Another crucial point is the integration of multiple sources. Remote sensing cameras along the river help model plastic flows with AI support; high-definition drone images identify land use and accumulation points; drifting devices with GPS show how materials move; and time-lapse surveys capture seasonal variations. When these layers combine, the problem ceases to be abstract and becomes an action map.
How Drones, AI, and GPS Track Waste Upstream
Drones serve a high-resolution territorial role. They help locate areas with recurring waste deposition, connections between urban drainage and the main watercourse, as well as stretches where waste tends to accumulate due to the geometry of banks, vegetation, or obstacles. This perspective allows for the separation of transit points from retention points, something essential for deciding where to intervene first.
GPS drifting trackers act as “behavioral markers” of the flow. Instead of assuming the trajectory of the waste, the team observes the actual movement of floating objects under different conditions. This makes it clearer how long materials take to traverse certain stretches, which areas function as transport corridors, and where there is waste convergence. AI steps in to consolidate these signals and generate models that project risk and concentration with greater consistency.
Where to Block First and Why Not Every Point Yields the Same Result
One of the central conclusions of this type of survey is that not every location delivers the same impact. The objective is not to spread equipment evenly but to prioritize stretches that concentrate greater contributions to the total flow of plastic. In practical terms, this improves cost-effectiveness and reduces the time between investment and environmental result.
In the case of Mumbai, the diagnosis indicated that 80% of the plastic originated from 30% of the rivers. This data completely changes the strategy: instead of trying to do everything at once, the city can focus on points with a disproportionate impact on reducing downstream waste emissions. Without robust measurement, this choice becomes a gamble; with measurement, it becomes planning.
This focus also helps answer a recurring question in public management: where should physical intervention be combined with prevention at the source? In some stretches, the greatest gain comes from interception; in others, from correcting collection, drainage, and illegal disposal failures. Combatting waste becomes calibrated by section, not by generic discourse.
From Central Database to City Plan
After field collection, the data enters a centralized database that standardizes readings across different rivers and neighborhoods. This step is strategic because it allows for comparing areas, identifying infrastructure gaps, and building deployment scenarios with transparent criteria. When information is dispersed, public policy loses continuity; when organized, it gains execution capability.
The interactive map associated with the survey serves another important function: translating applied science for decision-making. In many cities, it is the first time that such information appears gathered in a single consultation environment. This reduces the distance between technical diagnosis and administrative decision, facilitating coordination among urban cleaning, environmental, planning teams, and local actors.
Real Limits and Conditions to Maintain Results Over Time
Although the methodology increases accuracy, it does not eliminate structural challenges. Waste flows change with heavy rain, seasonality, urban expansion, and disposal behavior. Therefore, occasional surveys need to be updated and compared over time to avoid outdated decisions. Intervention without continuous monitoring tends to lose efficiency.
There is also a governance component that cannot be ignored. Equipment and predictive models are tools; the outcome depends on operation, maintenance, institutional articulation, and community participation. Without this, the system identifies where waste passes, but the field response does not follow. Technology without management becomes a diagnosis without transformation.
What this approach shows, in concrete terms, is that confronting plastic pollution in rivers requires territorial intelligence: measure before installing, prioritize before expanding, integrate data before promising scale. By tracking waste with drones, GPS, and AI, the city gains a clear route to block filth within the river system, with more precise decisions and a more consistent environmental impact.
In your city, which point do you believe most contributes to waste flowing into rivers: collection failures in peripheral neighborhoods, poorly planned drainage, irregular commercial disposal, or lack of oversight in critical areas? Sharing local examples helps transform technical diagnosis into public pressure for real solutions.