
 Portuguese
  Spanish
SwissRad10 calculates how terrain and trees alter solar incidence across Switzerland, offering hourly data for research on forests, water, snow, and microclimates
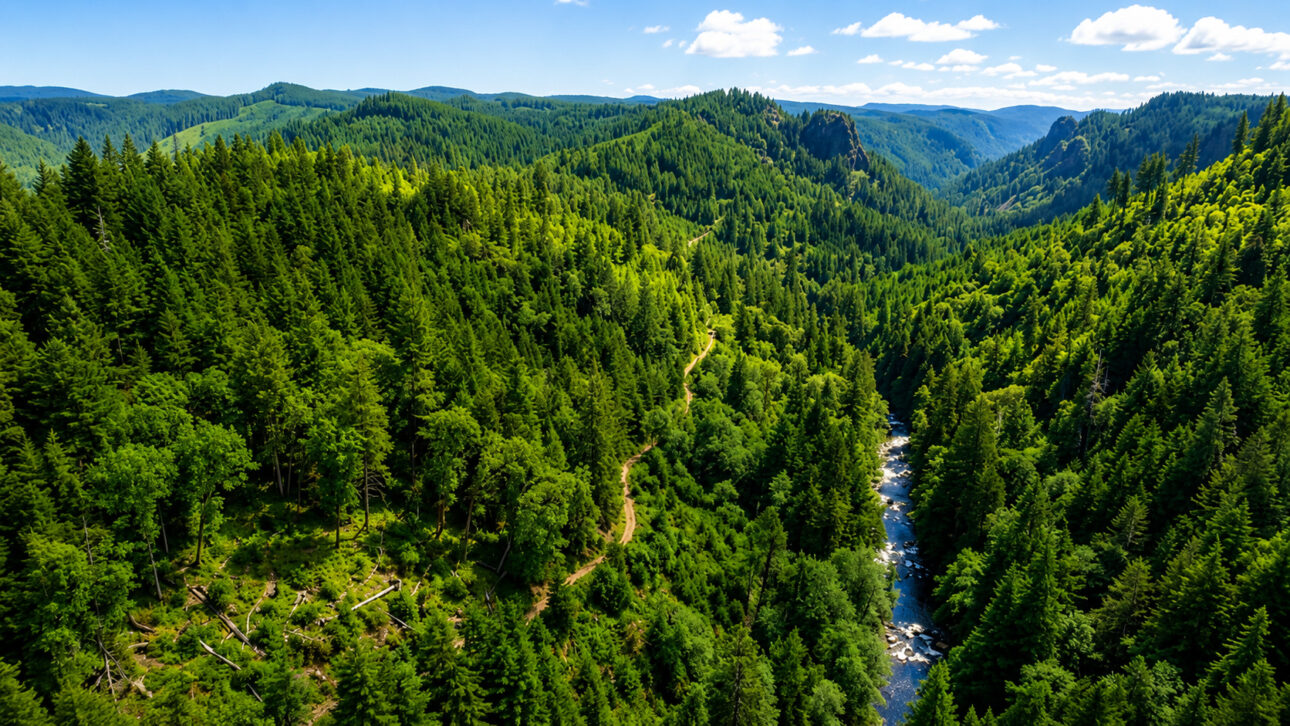
For those observing a mountain illuminated by the Sun, the difference between a bright slope and a shaded one may seem just part of the landscape.
For scientists, however, this difference helps explain how snow melts, how water flows, and how forests preserve moisture.
Swiss researchers decided to map precisely this variation.
-
Scientists Race to Harness Vast Underground Energy for Clean Electricity

-
23andMe Convinced 15 Million to Share Genetic Data, Went Bankrupt in 2025, and Auctioned DNA Database for $305 Million

-
Firefly Aerospace Becomes First Private Company to Successfully Land Lunar Module Upright on the Moon
-
Sony Announces Major Shift: Physical Disc Games for PlayStation to End by 2028, PS3 and PS Vita Stores to Gradually Close


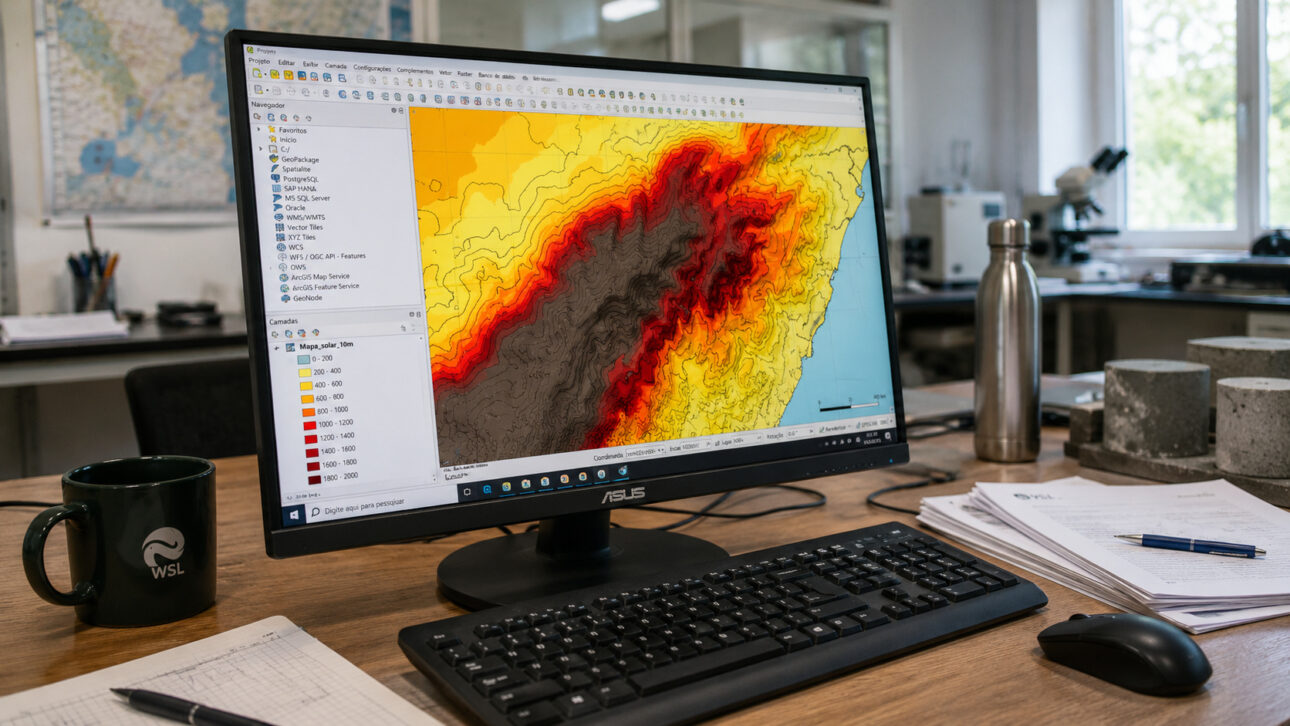
The project was named SwissRad10 and shows the potential availability of sunlight in areas as small as 10 meters.
The system analyzes fields, mountains, and forested regions. Additionally, it organizes records hour by hour throughout a complete annual cycle.
How the 10-meter solar map works
The map does not just show whether a certain area receives Sun or shade.
In practice, the model calculates how the solar position, terrain, and trees influence the amount of light that reaches the ground.
Researchers from the Swiss Federal Institute for Forest, Snow and Landscape Research, WSL, developed the technology with participation from the SLF Institute.
The system analyzes each point of the territory and considers nearby and distant natural obstacles.
In this way, a mountain can cast a shadow over a slope. At the same time, a closed canopy reduces radiation within the forest.
The system works with three main elements:
- Sky view factor, which calculates how much of the sky is visible from the ground;
- Direct solar transmissivity, which estimates how much radiation reaches each area;
- Scenarios with and without leaves, which represent seasonal changes in forests.
The researchers performed the calculations at two-minute intervals. Subsequently, they transformed the results into hourly averages.
An entire year of light transformed into data
SwissRad10 represents the period between January 1 and December 31, 2020.
This timeframe generated 8,784 hourly records for each analyzed section.
The researchers constructed the vegetation base with laser surveys conducted between 2012 and 2023.
These measurements represented the relief, the height of trees, and the structure of Swiss forests.
In 2024, the team made the data publicly available on the environmental platform EnviDat.
The methodology brought together researchers like Clare Webster, Christian Ginzler, Mauro Marty, Anita Nussbaumer, Giulia Mazzotti, and Tobias Jonas.

What sunlight reveals about snow and water
The amount of radiation reaching the ground directly affects the melting of snow.
An illuminated slope can lose its white cover more quickly. Meanwhile, a shaded region tends to retain snow for longer.
For this reason, the map supports studies on:
- Potential speed of snow melting;
- Surface water runoff;
- Moisture distribution in the terrain;
- Evaporation in open and forested areas.
This information makes environmental models more detailed.
Consequently, researchers can compare nearby areas that exhibit distinct behaviors due to shadow.
Forests also gained a light map
Within a forest, solar incidence affects the growth of plants, seeds, and sprouts.
The shade of the trees also reduces soil heating. Additionally, it conserves part of the moisture during the hotter periods.
The SwissRad10 compares forests with leaves and without leaves.
This difference matters because the amount of light changes throughout the seasons.
In winter, trees without foliage allow more radiation to reach the ground. During the greener months, the canopies act as a natural cover.
Thus, the data helps study forest microclimates and cold refuges used by different species.
A new tool for planning the Swiss territory
The great advantage of SwissRad10 lies in the combination of national scale, high resolution, and hourly frequency.
The researchers calculated more than 770 million synthetic hemispherical representations to build the set.
The maps also use cartographic information from swisstopo, the official body responsible for Swiss national cartography.
With this, scientists and planners now have a public base for ecological, hydrological, and climatic research.
The SwissRad10 transforms light, something seemingly impossible to capture on a map, into a measurable layer of the territory.
Every mountain shadow and tree canopy now integrate into a national atlas that shows how the environment changes throughout the hours.
And you, did you imagine that a light difference of just 10 meters could change snow, water, and forests so much?


