Portuguese
  Spanish
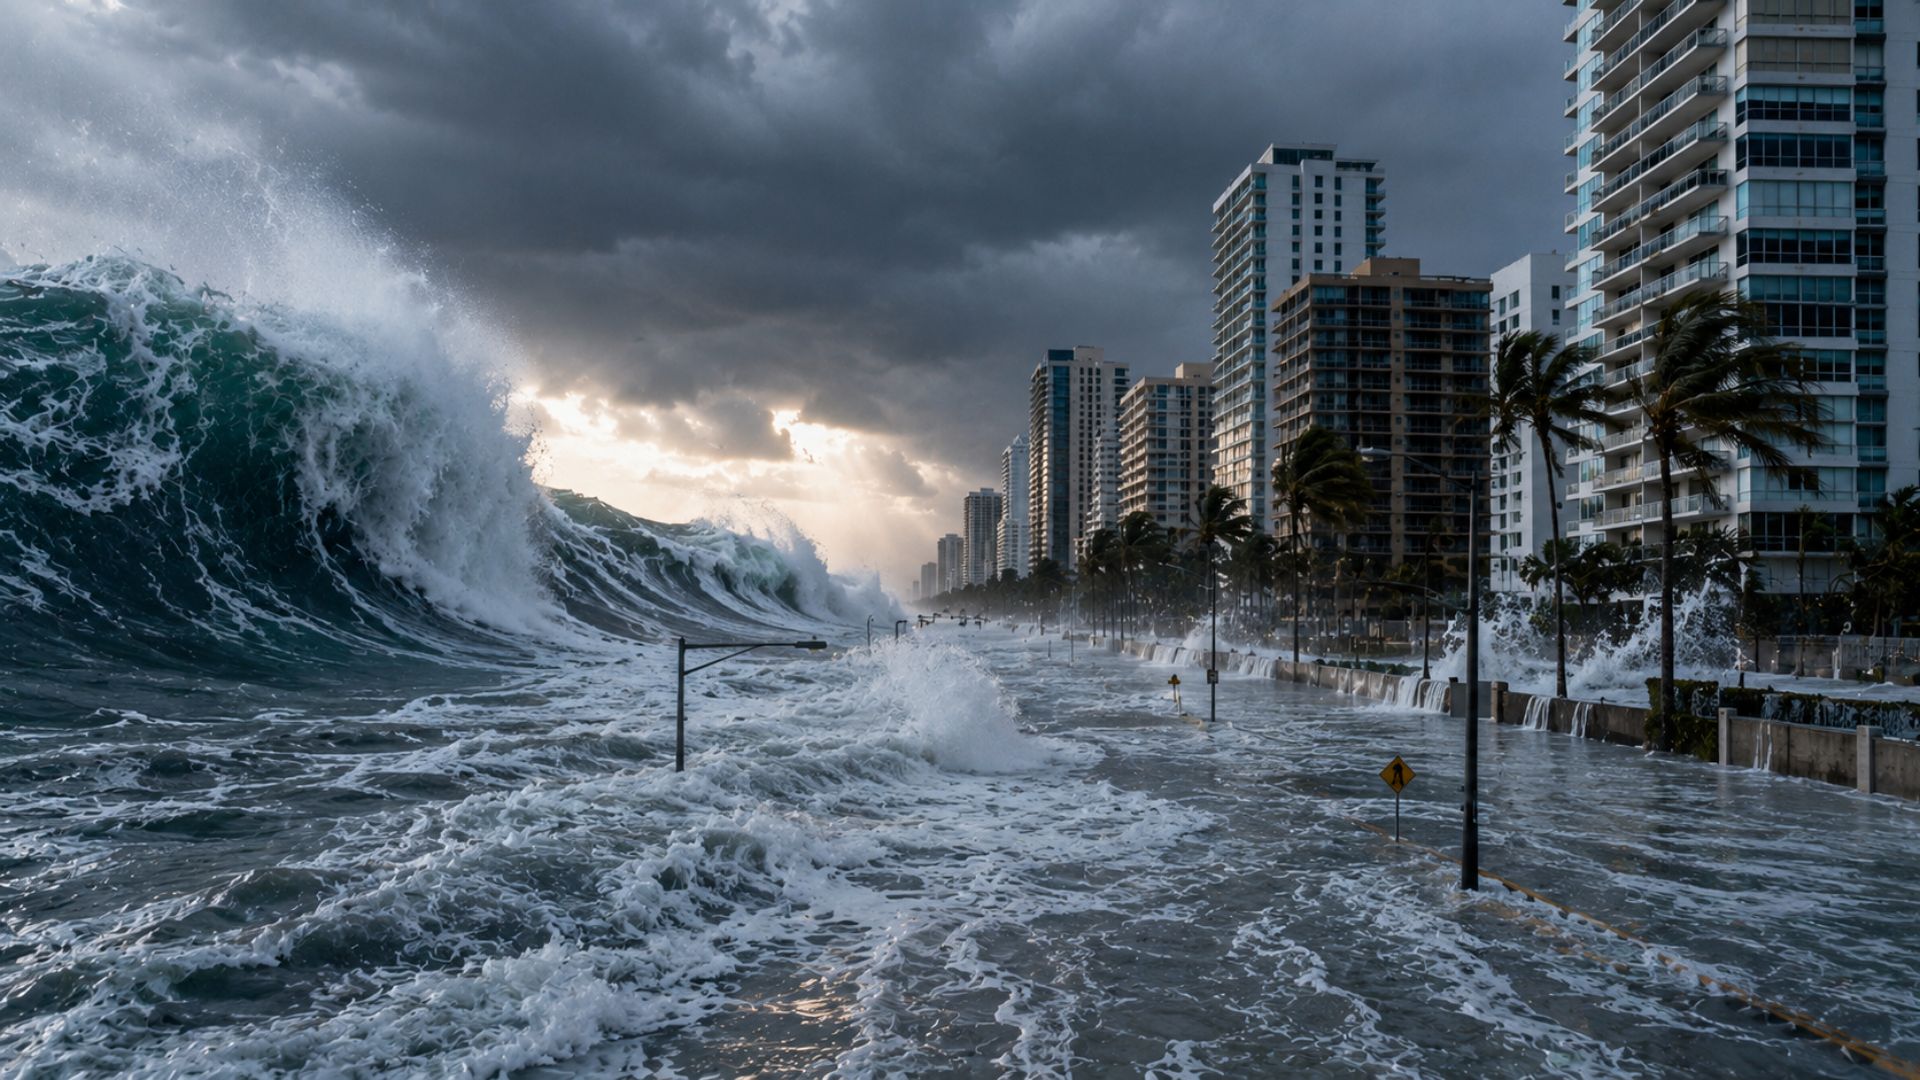
Up to 132 million more people could fall below sea level, according to a study published in Nature that reviewed 385 studies on coastal risk. More than 9 out of 10 used a theoretical model instead of actual measurements, underestimating sea level and requiring correction of risk maps worldwide.
In March 2026, a study published in the prestigious scientific journal Nature raised an alert about the coastal risk maps used worldwide. Researchers Katharina Seeger from the University of Cologne and Philip Minderhoud from Wageningen University and the Deltares institute, both in Europe, reviewed 385 scientific studies on coastal exposure published between 2009 and 2025 and concluded that more than 9 out of 10 underestimated the actual sea level on the planet’s coasts due to a methodological flaw that persisted for over a decade.
The impact of this correction is significant. According to the study, applying the correct sea level in a scenario of a relative rise of 1 meter, the area that would fall below water increases by 37%, and the number of exposed people grows by 68%, representing up to 132 million more individuals at risk than previously calculated. It is important to clarify, however, that the work does not question global warming or sea level rise itself: what it points out is a reference error in the maps, which were using a theoretical base instead of actual ocean measurements.
What was the error found in the studies on sea level

The majority of coastal risk assessments did not correctly combine two essential types of data: the altitude of the terrain on the coast and the actual sea level measured on site. Instead of using direct tide measurements, made by equipment such as tide gauges and buoys, more than 90% of the studies adopted the so-called geoid, a mathematical model based on Earth’s gravity and rotation, as if it were the true sea level.
-
Brazilian Researcher Unveils Innovative Intraocular Lens for Cataract Treatment with High-Precision Optics, Enhancing Vision at Multiple Distances and Reducing Unwanted Visual Effects

-
World’s Largest Particle Accelerator Begins Four-Year Hiatus for Magnet Overhaul, Aiming to Hunt Dark Matter by 2030
-
“Sahara Dust Turns Rain Red, Startling Residents Across Europe”
-
Stanford Scientists Develop 20-Cent Paper Centrifuge Inspired by Ancient Toy, Spins at 125,000 RPM Without Electricity, Separates Plasma in 1.5 Minutes, Aiding Diagnostics in Remote Areas


The geoid is a theoretical surface that approximates the shape of the Earth’s gravitational field, but the actual coasts rarely coincide with this idealized surface. Winds, ocean currents, astronomical tides, temperature, and water salinity alter the local ocean level daily, factors that the geoid simply ignores. By treating this abstract model as the zero level for beaches and ports, studies began their calculations from a lower base than the physical reality of the sea, underestimating the exposure of coastal areas.
How much was the difference in sea level

According to the study, the sea level measured on the coasts is, on a global average, 0.24 to 0.27 meters higher than the value assumed by theoretical models, depending on the geoid used. It may seem small, but in low-altitude and high-population-density regions, a few centimeters already make a difference between a safe area and a flood-prone area in urban planning and coastal engineering.
In some specific points of the globe, however, the discrepancy was much greater, reaching an impressive 5.5 to 7.6 meters difference between the assumed level and the real sea level. More than 99% of the evaluations analyzed, according to the authors, inadequately handled sea level and terrain altitude data. The lack of transparency in the documentation of many of these studies made it difficult for reviewers to notice the propagation of error from one study to another over the years.
Which regions suffer the greatest impact from the correction
The correction of these maps does not affect all regions in the same way, and this is one of the most relevant findings of the study. Developed nations, especially in Europe and much of the Atlantic coast, tend to have more advanced coastal monitoring and suffered smaller discrepancies. Meanwhile, the most vulnerable areas of the so-called Global South faced the worst differences between the assumed and real sea levels.
Southeast Asia and the Indo-Pacific region appear among the most affected, with differences reaching 1 to 1.5 meters above previous bases in some locations. This means that densely populated deltas and entire islands in these regions may be much closer to the flood line than their governments estimated. Latin America and the Caribbean also figure among the areas that urgently need to revise their maps of exposure to sea level rise, according to the survey.
Why the error went unnoticed for so long
One of the most intriguing questions is how such a widespread flaw managed to spread and remain unnoticed for over a decade. The explanation lies in the disconnect between two technical areas: topography, which measures the altitude of the terrain, and physical oceanography, which studies the actual behavior of the waters. Altitude and sea level data are often collected by different satellites, with distinct vertical reference systems, and require careful conversion to be correctly combined.
This conversion simply was not done adequately in most studies. As many publications did not clearly document which sea level base they had adopted, the erroneous assumption silently propagated into new research, which repeated the shortcut without realizing it. The result was the consolidation of inaccurate data that today compromises the planning of various coastal metropolises and requires a broad reevaluation of the methodology used in coastal science.
What changes for engineering and coastal planning
The practical consequences of the correction are significant for infrastructure. With the actual sea level higher than assumed, civil engineering parameters for coastal protection need to be revised. This includes the sizing of retaining walls and coastal dikes, which may need to be more robust and elevated, as well as urban zoning, which tends to become more restrictive in vulnerable areas to protect exposed communities.
This also includes the modernization of ports and maritime industrial complexes, which depend on accurate sea level calculations to operate safely. The authors of the study, however, offer a concrete solution: using supercomputers, they integrated four of the latest digital terrain elevation models with the most current sea level data on the coasts and made these datasets available as open access. The idea is to spare other researchers from complex calculations and allow for more realistic coastal analyses immediately.
What the study really says and what it doesn’t say
Given such a sensitive topic, it’s worth separating what the research actually concludes from what might lead to exaggerated interpretation. The study does not claim that global warming was underestimated, nor that glacier melting is greater than previously thought. The focus is strictly methodological: the way risk maps defined the starting point, the sea level zero, was wrong, causing these maps to underestimate how much land and how many people are already close to the current ocean level.
The additional 132 million people at risk, therefore, do not represent a new forecast of imminent catastrophe, but rather a correction of calculation regarding exposure in a hypothetical scenario of 1 meter of relative sea level rise. It is a subtle but crucial difference to avoid alarmism: the threat of sea level rise remains the same as science already knew, but the maps indicating who is at risk needed to be adjusted to reflect the physical reality of the coasts more accurately.
The study published in Nature is a powerful reminder of how seemingly small methodological details can have enormous effects on decisions that affect millions of people. By revealing that 9 out of 10 coastal risk studies used an incorrect sea level reference, the researchers not only corrected the maps but also offered the tools to remake them better. For governments of coastal regions, including Brazil, the message is to invest in real and continuous measurements of their own coasts.
Do you live in or know someone who lives in a coastal region that may be affected by sea level rise? Do you believe that governments will take seriously the need to correct coastal risk maps? Leave your comment, share your thoughts on the advance of the sea over cities, and share the article with those interested in climate, science, and the future of populations living near the ocean.